The more you understand the concept you are trading, how it might behave under all sorts of market conditions, the less historical testing you need to do.
Tom Basso
My estimate is that fewer than 20 percent of the people trading the markets have a system to guide their trading or investing. Of those who do, most are just using predefined indicators and don’t understand the concepts behind their system. As a result, I asked a number of experts to write about the concepts that they trade. This is not an exhaustive discussion of the various concepts you might trade. It is just a sampling. Your goal in reading this chapter should be to think about each concept and determine if it fits your personality and your beliefs. The concept that fits will be the one you have the most success trading. But you must understand your concept thoroughly before you develop a system using it.
While I was writing the first edition of this book, I received a phone call from an expert on chaos theory. He said that the had been following my work for many years. He believed that I had a lot of integrity but what that I was very wrong about systems. He said that it was ridiculous to assume that any sort of system was possible – instead, it was all about luck and individual psychology. I said that I agreed with him if he were defining system as just an entry technique. Instead, I said, one had to develop a methodology with a positive expectancy through stops and exits in order to make psychology and position sizing meaningful.
Most people try to find a high-probability entry signal as their system. They typically have no concept of an exit or of adequate position sizing. This usually leads to a trading methodology with a negative expectancy. In contrast, people who understand the role that exits and position sizing play in systems can be quite satisfied with an entry system that produces only 40 percent winners. I think my caller was a little stunned, but he then went on to say that I was wrong: “People cannot develop any sort of expectancy based on past data, ” he said. Yet interestingly enough, this person had still written a book about how to make “big” money from the market through understanding chaos theory.
I found the conversation quite interesting. I thought that I was one of the most open people around because I come from the viewpoint that you can trade ANY concept as long as you have a positive expectancy. What I learned is that even this basic assumption about being able to trade any concept with a positive expectancy is still an assumption – an assumption that forms the basis for my thinking about systems. As I’ve said before, we can trade only through beliefs. Keeping that assumption in mind, let’s look at a few trading concepts that are used by many traders and investors.
Trend Following
I’ve contacted some great traders (and wonderful friends) to write about these various concepts. You’ve already met Tom Basso, since he was interviewed in Chapter 3. Tom and I have done about 20 workshops together, and I can testify from personal experience that he is the most balanced trader I have ever met. Although Tom is now retired, when he was trading, he was the most mechanical trader I’ve ever met. Everything in his office was computerized. Even the trading orders went out to the broker via computer-generated fax. Tom traded two computerized trend-following systems, so I thought he was the most logical choice to write on trend following.
Tom Basso : The Philosophy of Trend Following
Many successful investors fall into a group called trend followers. In the following discussion I will attempt to describe what trend following is all about and why investors should be interested in using these general principles in their investing endeavors. Let’s break down the term trend following into its components. The first part is trend .Every trader needs a trend to make money. If you think about it, no matter what the technique, if there is not a trend after you buy, then you will not be able to sell at higher prices. You will take a loss on the trade. There must be a trend after you buy in order to sell at higher prices. Conversely, if you sell first, then there must be a subsequent trend down for you to buy back at lower prices.
Following is the next part of the term. We use this word because trend followers always wait for the trend to shift first, then they “follow” it. It the market is moving down and then indicates a major shift to the upside, the trend follower immediately buys the market. In doing so, the trader follows the trend.
“Let your profits run. Cut your losses short.” This old trader’s axiom describes trend following perfectly. Trend-following indicators tell the investor when the direction of a market has shifted form up to down or from down to up. Various charts or mathematical representations of the market are used to measure the current direction and observe the shift. Once in a trend, the trader sits back and enjoys the ride, as long as the trend keeps going in the trader’s direction. This is “letting profits run.”
I once heard a new investor questioning a very successful trend follower. The trend follower just bought some foreign currency contracts, and the novice asked, “Where’s your objective on this trade?” The trend follower wisely answered, “To the moon. I’ve never had one get there yet, but maybe some day ….” That tells a lot about the philosophy of trend following. If the market cooperates, the trend follower would get into the trade as soon as the market met his or her criteria for “trending” and would stay in it for the rest of his or her life.
Unfortunately, the trend usually ends at some point. As a result, when the direction shifts, then the cutting-losses-short aspect of the axiom should come into play. The trader, sensing that the direction of the market has shifted against the position, immediately liquidates. If the position is ahead at that point, then the trader has made a profit. If, at the time, the position is behind, then the trader has aborted the trade, preventing a runaway loss. Either way, the trader is out of a position that is currently going against him or her.
The advantage of Trend Following
The advantage of trend following is simple: you will never miss a major move of any market. If the market you’re watching turns from a down to an up direction, any trend-following indicator must flash a buy signal. It’s just a question of when. If it’s a major move, you will get the signal. The longer term the trend-following indicators are, the lower the transaction costs – a definite advantage of trend following.
Strategically, the investor must realize that if he or she can get onboard a major move in almost any market, the profits from just one trade can be substantial. In essence, one trade can make your whole year. Thus, the reliability of one’s strategy can be far below 50 percent and you’ll still show a profit. This is because the average size of one’s winning trades is so much greater than the size of one’s losing trades.
The disadvantage of Trend Following
The disadvantage of trend following is that your indicator cannot detect the difference between a major profitable move and a short-lived unprofitable move. As a result, trend followers often get whipsawed as signals immediately turn against them, resulting in small losses. Multiple whipsaws can add up, creating concern for the trend follower and attempting him or her to abandon the strategy.
Most traders spend a large amount of time in nontrending conditions. Trending periods could be as little as 15 to 25 percent of the time. Yet the trend follower must be willing to trade in these unfavorable markets so as not to miss the big trend.
Does Trend Following still work?
Absolutely! First, if there were no trends, thee would be no need for organized markets. Producers could sell the marketplace without worrying about having to hedge to protect themselves. End users would know that they could obtain the products they need at a reasonable price. And people would buy shares of companies purely for the income from dividends. Thus, should trends disappear for any length of time, those markets would probably ceases to exist.
Second, if there were no trends, you could expect a fairly random distribution of price changes. Yet if you look at the distribution of price changes over time in almost any market, you’ll see a very long tail in the direction of large price changes. This is because there are abnormally large price changes that you’d never expect to see by chance over a given period of time. For example, the S&P futures market opened in 1982, and within five years it had a price move you might expect to see once every hundred years. These abnormally large price changes over a short period of time are what make trend following work, and you see them all the time.
Is Trend Following for Everyone?
Trend Following is probably one of the easiest techniques for the new trader or investor to understand and use. The longer term the indicators, the less that total transaction costs will affect profits. Short-term models tend to have difficulty overcoming the costs of many transactions. Costs include not only commissions but also slippage on the trades. The fewer trades you make, provided you have the patience for it, the less you spend in transaction costs and the easier it is for you to make a profit.
There are numerous examples where trend following is not appropriate. Floor traders who are scalping ticks are not likely to use a trend-following concept. Hedging investors may find it more risky to hedge their risk by using trend-following indicators than by choosing some form of passive economic hedge approach. Day traders may find it difficult to use trend-following methods. When day trading, you cannot let profits run due to the time limits of day trading. The day simply ends, forcing the trader to liquidate the position.
If trend following fits your personality and your needs, then give it a try. There are many examples of successful traders and investors who consistently use this time-tested approach to the markets. With the economic world becoming more unstable, there are constantly new trends for the trend follower to exploit.
Editor’s Comments
Trend following is probably the most successful technique for trading or investing of all the concepts discussed. In fact, almost all the system models presented later in this book work because of trend following. As Basso points out, the biggest problem with it is that markets don’t always trend. However, this is generally not a problem for people who play the stock market. There are thousands of stocks that you can trade – on either the long or the short side. If you are willing to go both long and short, then there are always good trending markets.
The difficulty many people have with the stock market is that (1) there are times when few stocks are trending up so that the best opportunities are only on the short side; (2) people don’t understand shorting so they avoid it; (3) the exchange regulators make it difficult to short (that is, you have to be able to borrow the stock to short and you have to short on an uptick;) and (4) retirement accounts typically prohibit shorting. Nevertheless, if you plan for short selling, then it can be very lucrative under the right market conditions.
Fundamental Analysis
I’ve asked another friend, Charles LeBeau, to write the section on fundamental analysis. LeBeau is well known as a former editor of a great newsletter entitled the Technical Traders Bulletin. He is also a coauthor of an excellent book, Computer Analysis of the Futures Market. Chuck is a talented speaker, and he frequently gives talks at investment conferences. And he has been a guest speaker at many of our How to Develop a Winning Trading System That Fits You workshops. Chuck is now retired and lives near Sedona, Arizona. When he was an active trader, he was a commodity trading advisor (CTA), and later on he had his own hedge fund.
You might wonder why I asked Chuck, who has such an extensive technical background, to write about fundamental analysis. Chuck used to lecture about fundamental analysis for a major university, and he also ran a discretionary fundamentally based trading system for Island View Financial Group. In Chuck LeBeau’s words, “I prefer to think of myself as a trader who is willing to use the best tools available to get the job done.”
Charles LeBeau: Introduction to Fundamental Trading
Fundamental analysis, as it applies to futures trading, is the use of actual and/or anticipated relationships of supply and demand to forecast the direction and magnitude of future price changes. There may be more precise and detailed definitions, but this brief overview is intended to be about the benefits and practical applications of fundamental analysis.
Almost all traders mistakenly assume that they must be either fundamentalists who rely solely on supply-demand analysis or technicians who ignore fundamentals entirely and make their decisions based solely on price action. Who forces us to make such unnecessary and illogical either-or decisions about how best to trade? If you ever have two or more good ideas, you will almost certainly be better off if you do them all rather than falling into the either-or trap.
Fundamental analysis has a distinct advantage over technical analysis in the area of determining price objectives. Correctly interpreted, technical indicators can give you direction and timing, but they will fall short in giving you any indication of the magnitude of the anticipated price movement. Some technicians claim that their methods give them price objectives, but after 40 years of trading, I have yet to find any technical methods that were valid at forecasting price objectives. However, there is no question that good fundamental analysis can help you determine approximate profit objectives. By employing fundamental price targets, you should have a general idea of whether you want to take a quick, small profit or hold for a major long-term price objective. As limited as the accuracy of fundamental price targeting might be, having even a general idea of the magnitude of the profit you are expecting is a big advantage in successful trading.
Fundamental analysis does have definite limitations. The results of the best possible fundamental analysis will be painfully imprecise. If you do everything right, or better yet, rely on the sophisticate analysis of a true fundamental expert, you might be able to conclude that a particular market will probably make a “big” move in an upward direction at some vague time in the future. At its best, fundamental analysis will tell you only the direction and general magnitude of future price movements. It will rarely tell you when the price movement will begin or exactly how far prices will travel. However, knowing the direction and general magnitude of future price changes is certainly critical information that can be invaluable to a trader Our logical combination of fundamental and technical analysis will supply several important pieces of the trading puzzle – with position sizing (covered elsewhere in this book) being the missing piece.
How to employ fundamental analysis
Let’s deal with the practical aspect of successfully employing fundamental analysis. The suggestions that follow are based upon many years of actual trading with fundamental and are not necessarily listed in order of importance.
Avoid doing your own fundamental analysis even if you have some highly specialized training
I’ve been trading futures for 40 years and frequently lecture on fundamental analysis to graduate students at a major university, yet I wouldn’t think of doing my own fundamental analysis. True fundamental experts, who are much better qualified than you or I, are devoting full time to this task, and their conclusions are readily available at no cost.
Start looking around to find qualified experts whose fundamental analysis is available to the public. Call the major brokerage firms and ask them to put you on their mailing lists. Get a trial subscription to Consensus and read all the analyses. Pick out the ones you like and weed out the weaker sources. Look for analysts who are willing to make helpful forecasts and don’t beat around the bush all the time. Remember that you only need one good source of fundamental information for each market. If you get input from too many sources, you will receive conflicting input and become confused and indecisive.
News and fundamental analysis are not the same thing
Fundamental analysis predicts price direction, while news follows price direction. When I was a senior executive at a major commodity firm, the media would often phone me after the markets had closed and ask why a particular marked had gone up or down that day. If the market had gone up, I would give them some bullish news that had come to my attention. If the market had gone down, I would give them some bearish news. There is always plenty of bullish and bearish news floating around the markets each day. What gets reported in the papers is whatever “news” happens to correlate with the direction of the price for that day.
You will also observe that pending news will move a market longer and further than actual reported news. The anticipation of bullish news can support a market for weeks or even months. When the bullish news is eventually reported, the market may well move in the opposite direction. That’s why the old adage of “Buy the rumor, sell the fact” seems to work so well. (Of course, the same logic applies to bearish news as well.)
Be careful about reacting to fundamental reports
For example, let’s assume that a crop report has just been released showing that the soybean crop is going to be 10 percent smaller than it was last year. At first glance this might seem to be very bullish because the supply of beans was being reduced substantially. But if the traders and analysts involved in this market had expected the report to show 15 percent fewer beans, the prices might decline severely on the “bullish” report. Before you can analyze the bullishness or bearishness of a report, you have to be aware of what the expectations are and put the report into the context of the expectations. Also, don’t judge the bullishness or bearishness of a report by the initial reaction. Give the market some time to digest the news. You will often find that the first reaction to a report is either overdone or incorrect.
Look for markets that are encountering rising levels of demand
Demand is the motivator that makes for long sustained uptrends that are easy to trade for big profits. Demand-driven markets are the markets where you can make long-term trades that produce unusually high levels of profitability. Of course, markets will also rise because of supply shortages, but you will often find that price rallies motivated by supply concerns tend to be short lived and the long-term price forecasts in these supply-shortage markets are generally overestimated. Look for demand-driven markets to trade.
Timing is important, so be patient with your fundamental scenario
The best fundamental analyst seem to be able to forecast price trends much more easily than most market participants. Of course, this is an advantage if you are careful about your timing. However, if you are impulsive and enter the market too soon, you can lose a great deal of money over the short run. Be patient and let your technical indicators tell you when the market is beginning to trend in the direction it should. Remember, the goal is not to be the first to have the correct forecast. The goal is to make money and keep your risk under control. You may have to wait weeks or even months to take advantage of an accurate fundamental forecast. Acting too soon could easily turn an accurate forecast into a losing trade.
Many forecasts of major price changes fail to materialize for one reason or another
If you have done a good job of finding accurate sources of fundamental information on a broad group of markets, you might expect to become informed of 8 to 10 forecasts of a major price change in a typical year. Of these forecasts, only 6 or 7 are likely to occur. But if you can manage to get positioned in half of those in a timely fashion and then do a good job of letting the profits run, you should have an extremely profitable year.
Be decisive and willing to take your share of losses
Don’t be afraid to chase after markets that are moving with big fundamental potential. Many traders, fundamental or technical, lack the nerve or discipline to get into a market once it has started running. It is human nature to want to get in at more favorable prices and to postpone your entry waiting for a pullback that may never come. You must have confidence and the courage to take action promptly. The best analysis, fundamental or technical, is worthless in the hands of an indecisive “trader”. If in doubt, start with a small position and then add to it later.
I hope this brief introduction to fundamental analysis has provoked an idea or two and perhaps convinced you that fundamental analysis might have a place in your trading plan. If so, I would strongly urge you to learn more about this topic. The best book, in my opinion, on the topic is entitled Schwager on Futures : Fundamental Analysis by Jack Schwager. Anyone interested in using fundamentals in trading method find this well-written book extremely helpful.
Editor’s Comments
Chuck LeBeau’s comments apply primarily to futures trading and could be used in the methodology developed by Gallacher that is presented later in this book. If you are a stock market trader or investor, look at the value section presented next. In addition, two systems that involve fundamentals will be presented later for your consideration – William O’Neil’s CANSLIM system and Warren Buffett’s business model. Buffett’s model is almost totally fundamental, while O’Neil’s model relies on fundamentals for setups.
Value Trading
Value trading is one of the major methods used by portfolio managers to trade the stock market. Basically, your goal is to buy when something is undervalued and sell it when it’s at fair value or when it is overvalued. If you are willing to short stock, you can also short it when it is overvalued and buy it back when it reaches fair value or becomes undervalued. Many people do the former and few do the latter. I chose to write this section myself as I trade the “value concept” in the retirement funds I manage for my company.
What works in value investing
Many of the greatest investors in the history of the stock market would probably call themselves “value traders.” The list would include Warren Buffett and his mentor Benjamin Graham. It would also include such luminaries as Sir John Templeton and great investors such as Michael Price, Mario Gabellio, John Neff, Larry Tisch, Marty Whitman, David Dreman, Jim Rogers, and Michael Steinhardt – just to name a few. All of these masters are the same in that they emphasize value. Yet all of them are different because they define value a little bit differently. In this brief section on value investing, I will touch on the ideas that I believe work and the ideas that I believe do not work. I’d also like to add a few precautions that, in my opinion will make any form of value investing more successful.
First, let’s talk about what works. What works all the time in value investing, assuming you have a little patience, is buying something at a huge discount to what it is worth. But, of course, the key question you must ask yourself is how you determine worth. In my book Safe Strategies for Financial Freedom, I talk extensively about one of Benjamin Graham’s famous techniques for making money – Graham’s number technique. In this case, value is really simple: What’s the liquidation value of the company? If you were to sell all of the company’s assets within the next year, how much could you get for it? You can actually find this information when you look up a company at Yahoo or BusinessWeek. It’s called the company’s current assets. If you took the company’s current assets and subtracted its total debt, the you’d have a great idea about what the company is worth if you liquidated it within the next year.
Now what if you determined that a company’s liquidation value is $10 per share and also discovered that the company’s stock is currently selling for $7 per share? That’s what I call a value play. You can actually buy the stock at 70 cents on the dollar based upon the company’s liquidation value. That’s real value, and those stocks tend to be easy to find when the market is depressed. For example, when we were writing Safe Strategies for Financial Freedom in April 2003, we found a list of four stocks that made it through our screening. The market was starting to turn, so we were able to look at those same stocks nine weeks later on June 20 – just before the book was to go to press. Nine weeks later those four stocks were up 86.25 percent while the S&P was up only 15 percent over the same time period. However, I want to point out that this occurred at the bottom of a bear market decline and there have not been many stocks meeting these criteria since that time.
Finding stocks that are selling at a substantial discount to their liquidation value is an extreme form of value trading. There are other methods. For example, you could screen stocks that list assets on their books at an extreme discount to the true value. This could be done with land values, for example. What if a company lists its land assets at $1,000 per acre while the actual value is $50,000 per acre? If you can find such discounts, then you know you also have a highly undervalued stock. For example, several companies that own lots of land that they discount on their books include St. Joe (owns 3 percent of Florida carried on its books at $2 per acre), Alexander and Baldwin (owns Hawaiian land carried on its books at $150 per acre) and Tejon Ranch (has huge land holdings carried on its books at $25 per acre). Basically, if you buy these companies, you are buying land at almost nothing compared to what it is worth.
How to improve what works
One clear technique is to improve value trading for any investor is to observe the following precaution: Never buy an undervalued stock when it is going down. For example, if you find a stock selling at 70 percent of its liquidation value, you don’t necessarily want to buy it the next day. Yes, it’s a cheap stock, but it’s cheap because people are selling it for various reasons. That could continue for some time in the future. And just because it is undervalued today doesn’t mean that it won’t be more undervalued in two or three months.
Instead, let the stock prove itself. Get some indication from the market that the downtrend is over. I will never buy a value stock unless it has proven itself to me. At minimum, I want my stock to have formed at least two-month base, meaning that it has stayed in the same price range for two months. Even better, I’d prefer a stock to e going up for at least two months before I buy it. Now a pure value investor might get very upset at this idea, saying, “You could have gotten it cheaper!” That’s true, but we used that concept when we bought our value stocks in April 2003. Had be bought them much earlier, we could have held them for a year or more with no gains. It’s your choice, but remember that you trade only your beliefs about the markets, and you must determine whether or not your beliefs are useful.
Incidentally, if you use this concept of letting the market prove itself, you have a huge advantage over most portfolio managers who do value investing. The large portfolio manager might be purchasing millions of dollars’ worth of stock, and his purchase of the stock might have a significant impact on the price of the stock. As a result, he does not dare wait until the price starts going up. However, if you are only purchasing a small amount of the stock (that is, fewer than 10,000 shares), then you can afford to wait until the stock starts to move up. In fact, your clue may be that the big institutional investor have started to move into the stock you’ve discovered.
What does work in value investing
Wall Street pays stock analysts huge salaries to try to determine when something is undervalued. These analysts look at things like future products that will be introduced, the potential market for those products, and what selling that product could do for the company’s price in the next year. They sift through piles and piles of fundamental data in order to make forecasts about future earnings, they can then say, “This stock is undervalued” or “This stock is overvalued.”
In many years of experience as a trading coach, I’ve seen no evidence that this approach works. Most analysts are just guessing at many of the variables they look at. They say that company officials lie to them. But even if that didn’t happen, there is still no evidence (in my opinion) that their forecasts about future earnings are that meaningful in terms of the future performance of the stock. So if you want my advice, don’t play this game of value investing. It’s not a real measure of value.
Band Trading
Markets only trend about 15 percent of the time. So what do you do the other 85 percent of the time? You could not trade or you could find a strategy that works most of the time in most markets. One such strategy is band trading. D.R. Barton teaches our short-term trading workshops (Swing Trading and Day Trading0 and has been involved with using band trading for some time. D.R. even writes a newsletter based on a band trading technique that he has developed and tested. Consequently, I thought he’d be a good choice to write this section.
D.R. Barton, Jr: An overview of Band Trading
Traders and investors are often interested in a methodology that is effective across most market conditions. Band trading (also known as range trading) is one strategy that works in a great majority of market environments. We’ll describe those conditions in detail below. But first, let’s define band trading and look at the market beliefs that make band trading effective.
A band trading strategy attempts to buy at the bottom of a trading range and sell at the top of the range. Band trading is based on the belief that the market moves much lie a rubber band or a spring – stretching to a certain point and then pulling back. This type of action is easy to see and understand in a sideways market. The second half of the chart in Figure 5.1 shows price moving in a distinct sideways channel. Price moves to the top of the range (point 1), retraces to the bottom of the range (point 2), and then repeats the cycle (1 to 2 to 1).
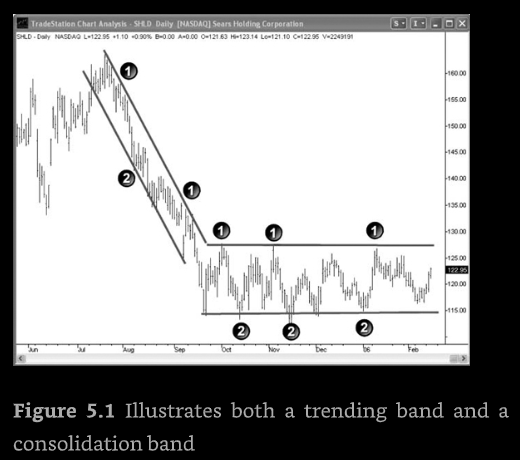
While using bands for sideways markets is fairly well known , fewer folks know that band trading can be very effective in trending markets as well. Even when trending, markets rarely move straight up or straight down. More common is the “three steps up, two steps back” action that characterizes most trends. Looking again at Figure 5.1, you can see that price is clearly in a downtrend early in the chart. However, you can still observe the same pattern of price movement that we saw in the sideways market: up to the top band (point 1), down to the lower band (point 2), and repeat back down to the lower band at point 2. This behavior of stretch and retrace, stretch and retrace gives us a repeatable action in the market that we can exploit.
Join the Bands : How Bands are Defined
Trading ranges can be represented visually and mathematically by three broad categories : channels, static bands, and dynamic bands. Channels are typically defined by a single price at the upper channel and another at the lower channel. These two channels remain stationary until they are redefined. An example is the well-known Donchian channel that uses the high of the last x number of days as the upper channel and the low of the last x number of days at the lower channel. A channel only changes when a new high or low is made.
Static bands consists of an upper and lower band, and each of these bands is drawn a set distance from a central (or basis) line. This type of band configuration is also called an envelope. Figure 5.2 shows the most common static band or envelope setup: a simple moving average with upper and lower bands drawn at a user-defined percentage above and below the moving average line (the chart shows a 20-day simple moving average, SMA, with band drawn at 5 percent of price above and below the SMA).
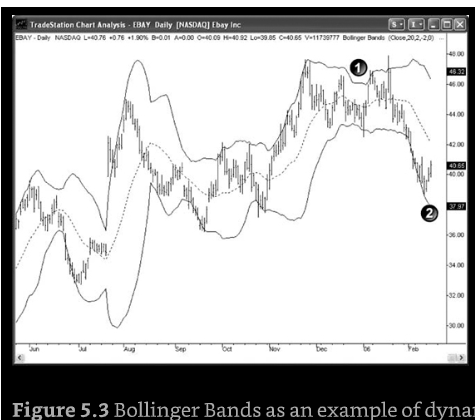
Dynamic bands start out the same as static bands – with a basis line (typically an SMA). But with dynamic bands, the distance between the basis line and the upper and lower bands varies – most typically as a function of current volatility. The most common type of dynamic bands is Bollinger Bands, named after their originator, John Bollinger. Figure 5.3 shows a set of Bollinger Bands using the default settings: the basis line represented by a 20-day simple moving average, with the upper and lower bands drawn 2 standard deviations above and below the basis line. (The standard deviation is a statistical measure that is commonly use to quantify volatility). Another common type of dynamic band uses average true range (ATR) to vary the upper and lower band distance from the basis line.
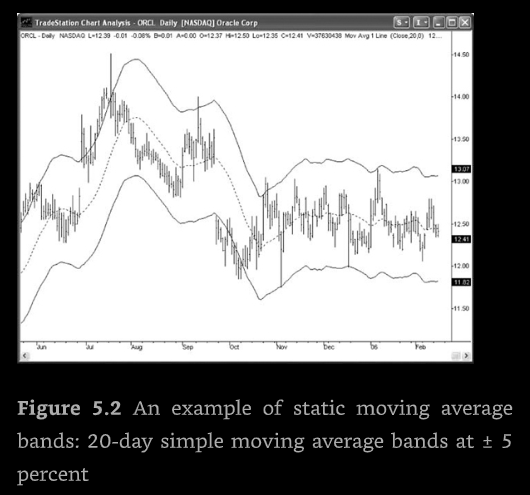
Figure 5.2 shows how Bollinger Bands adjust as volatility expands or contracts. Note how close together the bands are in times of low volatility (point 1) and how the bands widen when the volatility expands (point 2).
How to trade using bands
I have seen all three types of bands used effectively in trading systems. I personally write a newsletter based on using adaptive dynamic bands (though not Bollinger Bands) that has both tested well and traded well in real time. Here are some guidelines for trading using bands.
Whether you use static or dynamic bands, setting the width of the bands is a large part of the art and science of band trading. There are trade-offs in selecting the band width: using a one-size-fits-all parameter, such as 5 percent moving average envelope, ensures against curve fitting test parameters. But using 1 percentage for both volatile and less volatile instruments can lead to overtrading the volatile markets and undertrading the less volatile ones. Using an optimized band width for each market would almost certainly lead to overoptimized parameters that are not very robust in real-time trading. A useful compromise might be to find an optimum value for a sector of stocks or group of commodities with similar volatility.
You can make a band trade entry in two ways: pure countertrend entries or retracement entries. In a pure countertrend entry, you would sell (or short) the stock or commodity at the first touch of the upper band, or buy it after a touch of the lower band. In retrace option, you would wait and enter a prescribed retracement back into the channel between the bands after a band had been touched or penetrated. The key question you must ask yourself here is, “Do I want the position to be moving in my favor before I enter into my band trade?”
Once you are into a band trade, you ideally want to hold the position until it moves to the other band. Then you’d actually reverse your position. And in the ideal world, you’d watch the price go up, selling at the upper band, and then down, buying at the lower band. You’d have a profitable long trade, followed by a profitable short trade, followed by a profitable long trade, and so on. You’d have a nice stream of uninterrupted profits.
However, the world is not ideal, and band traders have to ask themselves all of the following questions:
- What if the bands are never touched?
- What if the bands break down and stop being accurate?
- What if the price goes in my direction after entry, but doesn’t come near the other band?
- And what if the price goes right through the band and keeps going?
While band traders must deal with all of these issues. And they do so by having a thorough understanding of the concept they are trading. You need to understand how your concept should work and when you are wrong. You need to understand the nature of the band you are trading and what to do if the band concept you are trading stops working. And you need to understand all of the worst-case scenarios that could happen when you are band trading. If you understand all of this, then you can take the concept and develop it into a methodology that really fits you.
The strength and weakness of band trading
Band trading can be the foundation of your trading toolbox on a useful complement to other strategies. To wrap up this section, let’s look at the pros and cons of band trading.
Strengths of band trading
Band trading is effective in many more market conditions than trend-following strategies. It works in up, down, and sideways markets as long as there is enough volatility to produce a usable band. This, along with more frequent opportunities to trade, allows a successful band trader to produce a smoother, less volatile equity curve than a trend follower. Therefore, band traders can often have a lower account equity requirement to successfully implement their strategy.
Weaknesses of band trading
Band trading requires entries that are countertrend in nature. You sell after a move up and buy after a move down. This is very difficult for many trend followers. There are some stocks and commodities that do not trend very well and make poor trend following candidates .Likewise, there are those that have ranges that are too tight for band trading or do not trade well in ranges (they frequently extend far past bands, for example). These can be identified only through experience and/or backtesting.
Editor’s Comments
Band trading typically gives you lots of trading opportunities, and it is excellent for short-term traders. Thus, if you like (1) lots of trading activity, (2) selling highs, and (3) buying lows, then some form of band trading might be right for you.
If you look at the charts, you’ll see many examples that work very well and many examples that do not work at all. Your job as a band trader would be to (1) maximize the good trades and (2) minimize the losing trades by either filtering them out or reducing their impact through your exits. But those are topics for later in this book because they are important for any system you might develop.
Seasonal Tendencies
In my opinion, Moore Research Centre, Inc. located in Eugene, Oregon, is the leading center for research on seasonal tendencies in the market. It specializes in computerized analysis of futures, cash, and stock pries. Since 1989 it has published a monthly report with studies on specific futures complexes that go all over the world. It also does great research on probabilistic tendencies in the market. As a result, I approached Steve Moore about doing this chapter. Steve said that the center had a specialist for communicating with the public – Jerry Toepke, the editor of Moore Research Center Publications. Jerry has authored many articles and has spoken at several conferences. Some of the graphs in this section are a bit old, but the points being illustrated are still valid and that’s what’s important.
Jerry Toepke : Why Seasonals Work
The seasonal approach to markets is designed to anticipate future price movement rather than constantly reacting to an endless stream of often contradictory news. Although numerous factors affect the markets, certain conditions and events recur at annual intervals. Perhaps the most obvious is the annual cycle of weather from warm to cold and back to warm. However, the calendar also marks the annual passing of important events, such as the due date for U.S. income taxes every April 15. Such annual events create yearly cycles in supply and demand. Enormous supplies of grain at harvest dwindle throughout the year. Demand for heating oil typically rises as cold weather approaches but subsides as inventory is filled. Monetary liquidity may decline as taxes are paid but rise as the Federal Reserve recirculates funds.
These annual cycles in supply and demand give rise to seasonal price phenomena – to a greater or lesser degree and in a more or less timely manner. An annual pattern of changing conditions, then, may cause a more or less well-defined annual pattern of price responses. Thus, seasonality may be defined as a market’s natural rhythm, the established tendency for prices to move in the same direction at a similar time every year. As such, it becomes a valid principle subject to objective analysis in any market.
In a market strongly influenced by annual cycles, seasonal price movement may become more than just an effect of seasonal cause. It can become so ingrained as to be nearly a fundamental condition in its own right – almost as if the market had a memory of its own. Why? Once consumes and producers fall into a pattern, they tend to rely on it, almost to the point of becoming dependent on it. Vested interested then maintain it.
Patterns imply a degree of predictability. Future prices move when anticipating change and adjust when that change is realized. When those changes are annual in nature, a recurring cycle of anticipation and realization evolves. This recurring phenomenon is intrinsic to the seasonal approach to trading, for it is designed to anticipate, enter, and capture recurrent trends as they emerge and to exit as they realized.
The first step, of course, is to find a market’s seasonal price pattern. In the past, weekly or monthly high and low prices were used to construct relatively crude studies. Such analysis might suggest, for instance, that cattle prices in April were higher than in March 67 percent of the time and higher than in May 80 percent of the time. Computers, however, can now derive a daily seasonal pattern of price behavior from a composite of daily price activity over several years. Properly constructed, such a pattern provides historical perspective on a market’s annual price cycle.
The four primary components of any cycle are (1) its low point, (2) its rise, (3) its high point, and (4) its decline. When translated into a seasonal price pattern, those components become a seasonal low, a seasonal rise, a seasonal high, and a seasonal decline. A seasonal pattern, then, graphically illustrates an established tendency for market prices to anticipate recurring annual conditions of greatest supply-least demand, increasing demand – decreasing supply, greatest demand-least supply, and decreasing demand-increasing supply. From this pattern one may begin to better anticipate future price movement.
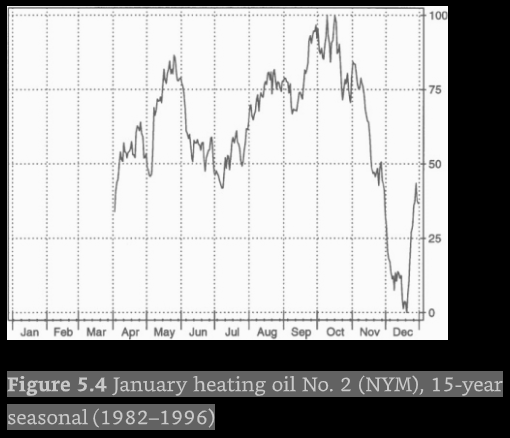
Consider the seasonal pattern that has evolved (1982-1996) for heating oil deliverables in January as shown in Figure 5.4. Demand, and therefore prices, is typically low during July – often the hottest month of the year. As the industry begins anticipating cooler weather, the market finds increasing demand for future inventory – exerting upward pressure on pries. Finally, the rise in prices tends to climax even before the onset of the coldest weather as anticipated demand is realized, refineries gear up to meet the demand, the market focuses on future liquidation of inventory.
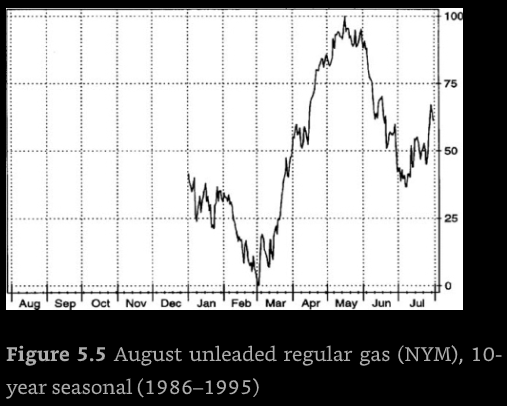
The other primary petroleum product encounters a different, albeit still weather-driven, cycle of demand as exhibited in the seasonal pattern (1986-1995) for August gasoline as shown in Figure 5.5. Prices tend to be lower during the poorer driving conditions of winter. However, as the industry begins to anticipate the summer driving season, demand for future inventory increases and exerts upward pressure on prices. By the official opening of the driving season (Memorial Day), refineries have enough incentive to meet that demand.
Seasonal patterns derived from daily prices rarely appear as perfect cycles. Even in patterns with distinct seasonal highs and lows, seasonal trends in between are subject to variations, sometimes conflicting forces before they are fully realized. A seasonal decline may typically be punctuated by brief rallies. For example, even though cattle prices have usually declined from March-April into June-July, they have exhibited a strong tendency to rally in early May as retail grocery outlets inventory beef for Memorial Day barbecues. Soybean prices tend to decline from June-July into October’s harvest, but by Labor Day the market has typically anticipated a frost scare.
Conversely, a seasonal rise may typically be punctuated by brief dips. For example, future uptrends are regularly interrupted by bouts of artificial selling pressure associated with first notice day for nearby contracts. Such liquidation to avoid delivery can offer opportunities both to take profits and then to enter or reestablish positions.
Therefore, a seasonal pattern constructed from daily prices can depict not only the four major components of seasonal price movement but also especially reliable segments of larger seasonal trends. Recognizing fundamental events that tend to coincide with these punctuations can provide even greater confidence in the pattern.
Consider the seasonal price pattern that has evolved (1981-1995) for September Treasury bonds as shown in Figure 5.6. The U.S. government’s fiscal year begins in October 1, increasing liquidity and easing borrowing demands somewhat. Is it merely coincidental that the tendency for bond prices to rise from then also tends to culminate with personal income tax liability for the calendar year?
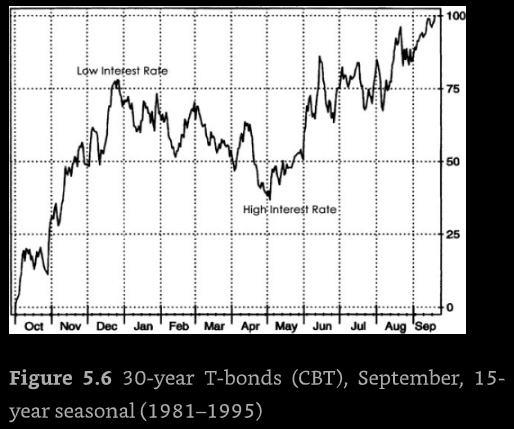
Is the seasonal decline into May a reflection of the market anticipating tighter monetary liquidity as taxes are paid? Notice the final sharp decline beginning – surprise! – April 15, the final date for payment of U.S. income taxes. Does liquidity tend to increase sharply after June 1 because the Federal Reserve is finally able to recirculate funds?
Take a close look at the typical market activity surrounding December 1, March 1, June 1, and September 1 – dates of first delivery against Chicago Board of Trade futures contracts on debt instruments. Finally, notice the distinct dips during the first or second week of the second month of each quarter – November, February, May, and August. Bond traders know that prices tend to decline into at least the second day of a quarterly Treasury refunding – at which time the market gains a better sense of the three-day auction’s coverage.
Consider also the pattern for November soybeans as shown in Figure 5.7 as it has evolved in the 15 years (1981-1995) since Brazil became a major producer with a crop cycle exactly opposite that in the Northern Hemisphere. Notice the tendency for prices to work sideways to lower in the “February break” as U.S. producers market their recent harvest and Brazil’s crop develops rapidly. By the time initial notices of delivery against March contracts are posted, the fundamental dynamics for a spring rally are in place – the Brazilian crop is “made” (realized), the pressure of the U.S. producer selling has climaxed, the market anticipates the return of demand as cheaper river transportation becomes more available, and the market begins focusing attention on providing both an incentive for U.S. acreage and a premium for weather risks.
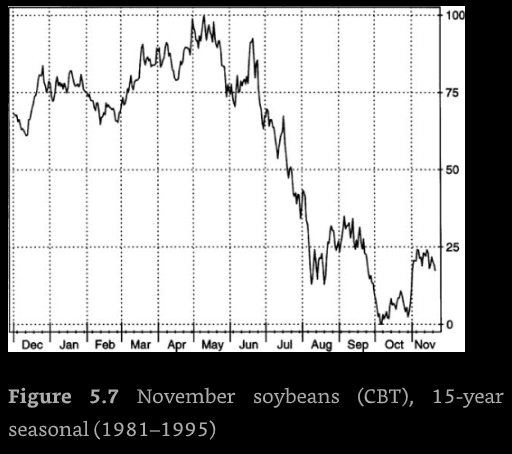
By mid-May, however, the amount of prime U.S. acreage available in the Midwest for soybeans is mostly determined and planting gets under way. At the same time, Brazil begins marketing its recent harvest. The availability of these new supplies and the potential of the new U.S. crop typically combine to exert the pressure on market prices. The minor peaks in late June and mid-July denote the tendencies for occasional crop scares.
By mid-August, the new U.S. crop is “made” (realized), and futures can sometimes establish an early seasonal low. However, prices more often decline further into October’s harvest low – but only after rallying into September on commercial demand for the first new-crop soybeans and/or concerns over early crop-damaging frost. Notice also the minor punctuations (decline and rally) associated with the first notice day for July, August, September, and November contracts.
Such trading patterns do not repeat without fail, of course. The seasonal methodology, as does any other, has its own inherent limitations. Of immediate practical concern to traders may be issues of timing and contra seasonal price movement. Fundamentals, both daily and longer term, inevitably ebb and flow. For instance, some summers are hotter and dryer, and at more critical times, than others. Even trends of exceptional seasonal consistency are best traded with common sense, a simple technical indicator, and/or a basic familiarity with current fundamentals to enhance selectivity and timing.
How large must a valid statistical sample be? Generally, more is better. For some uses, however, “modern” history may be more practical. For example, Brazil’s ascent as a major soybean producer in 1980 was a major factor in the nearly 180-degree reversal in that market’s trading patterns from the 1970s. Conversely, relying solely on deflationary patterns prevalent in 1985-1991 could be detrimental in an inflationary environment.
In such historic transitions, a time lag in the relevancy of recent patterns may occur. Analyzing cash markets can help neutralize such effects, but certain patterns specific to futures (such as those that are delivery-or expiration-driven) can get lost in translation. Thus, both sample size and the sample itself must be appropriate for their intended use. These may be determined arbitrarily, but only by a user who is fully cognizant of the consequences of his or her choice.
Related issues involve projecting into the future with statistics, which confirm the past but do not predict in and of themselves. The Super Bowl-winner/stock market-direction “phenomenon” is an example of statistical coincidence because no cause-and-effect relationship exists. However, it does raise a valid issue: When computers sift only raw data, what discoveries have meaning? Is a pattern that has repeated, for instance, in 14 of he last 15 years necessarily valid?
Certainly, patterns driven by fundamentals inspire more confidence, but to know all relevant fundamentals in every market is impractical. When one properly constructs seasonal patterns, one may typically find trends that have recurred in the same direction between specific dates with a great degree of past reliability. A “cluster” of such historically reliable trends, with similar entry and/or exit dates, not only reduces the odds of statistical aberration but also implies recurring fundamental conditions that, presumably, will exist again in the future and affect the market to one degree or another and in a more or less timely manner.
A seasonal pattern merely depicts the well-worn path a market itself has tended to follow. It is a market’s own consistency that provides the foundation for why seasonals work.
Editor’s Comments
Some people are promoting seasonal information that, in my opinion, has no meaning. This usually takes the form of information such as : The price of X has moved higher in 13 of the last 14 years on April 13. Computers will always find correlations of this nature, and some people will want to trade on the basis of them. However, trade a seasonal pattern without a logical cause-and-effect relationship behind it only at your own risk. The results of the January 2006 Super Bowl, for example, predicted an increase in the stock market for 2006. Would you have wanted to trade that?
Spreading
Kevin Thomas was one of the more powerful floor traders on the London International Financial Futures and Options Exchange (LIFFE) before it became and electronic exchange. Kevin was also the first person to complete our two-year Super Trader program. At the time this section was written, Kevin was trading mostly spreads on the floor. When I originally interviewed Kevin for one of my newsletters, he talked extensively about spreads. Consequently, I thought he was the logical person to write about the concept of spreading for this book. Kevin used the terms Eurodollars (meaning dollars traded in London) and Euromarks (meaning deutsche marks traded in London) because those are the contracts he used to trade. Some of the charts in this section reflect what Kevin used to trade when the exchange had active floor traders, but I’ve elected to keep them, even though they represent instrumetns that are no longer traded, because they still illustrate educational information about spreading.
Kevin Thomas : Introduction to Spreading
Spreads can be used in the futures market to create positions that behave long and short positions. These types of synthetic positions are well worth considering. They have several advantages over outright trading – a lower risk profile and a much lower margin requirement. In addition, some spreads can be charted like any other market.
For instance, in Eurodollars one could be long a nearby contract and short a contract a year further out, and this artificial position would take on the characteristics of a short position for only the spread margin rate. This type of spread is called an intercontract spread, and it can be used in markets that have liquid forward contracts. However, the behavior of the spread varies from market to market.
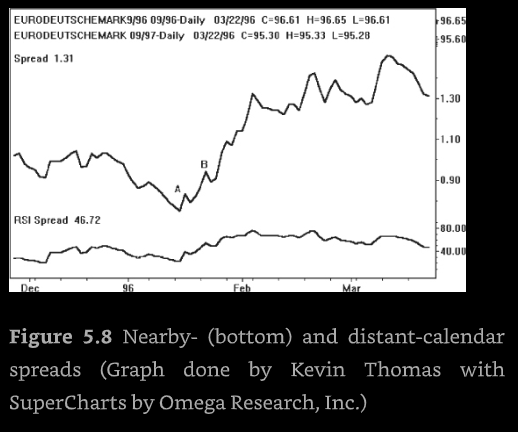
In interest rate futures, trading calendar spreads (spreading a nearby contract versus a forward contract) is a common strategy depending on your view of short-term interest rates. If you think rates are going to rise, then you would buy the nearby contracts and sell the forward contracts. More contract months between the two means more responsiveness and volatility of the spread. A spread between June and September of the same year is likely to be less volatile than a spread between September this year and September next year. This example in Figure 5.8 illustrates this.
Figure 5.8 shows the movement of the spread between September 1996 Euromarks and September 1997 Euromarks. I have drawn trendlines and included a 14-day RSI on the spread. Notice that there was a divergence at point A and a breakout at point B. This was a signal that short-term interest rates were about to rise. By being long the spread, you could have participated in the down move in the market that was coming. Notice that the spread then moved 76 ticks from the low to the high of the move.
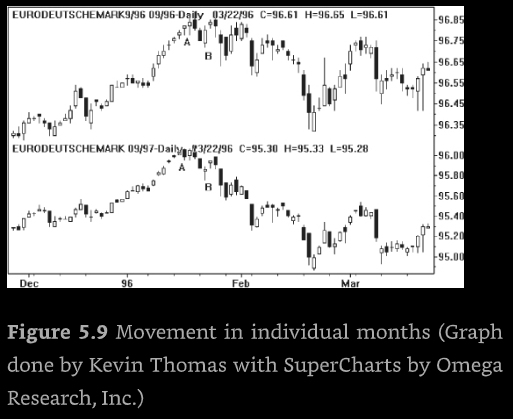
The charts in Figure 5.9 show how the individual months moved over the same period. Notice that the movement of the spread was in fact a good leading indicator of what was about to happen in the individual months. In addition, the move in the spread was more than the down move in September 1996 and about 75 percent of the down move in September 1997. The margin for the spread is 600 Euromarks per unit compared with 1,500 Euromarks for a straight futures position.
Such spread trading is a concept that is popular among floor traders because it enables them to participate in a position that has a lower risk profile than an outright futures position and has a good potential for profit. Once a spread position as been taken, then it can be treated like any other position you would have. Trend-following and position-sizing models can be applied.
By using spreads, you can create relationships that may not be available otherwise. Currency cross rates, for example, are spreads that can be created using International Monetary Market (IMM) currencies such as the deutsche mark versus the yen. This creates one of the most actively traded relationships in the world but one you wouldn’t think about if you just thought in terms of dollars or pounds. Another widely traded example would be trading cash bonds against bond futures, which is called basis trading.
By using spreads, you can create relationships that may not be available otherwise.
Another common strategy used in these markets is a butterfly spread, which is the difference between two spreads that share a common month (for example, long September 1, 1996, short December 2, 1996, and long March 1, 1997). Butterfly spreads are very expensive to trade because of the commission costs of an off-floor trader. However, a floor trader in such a market as Eurodollars or Euromarks can utilize this strategy because of the lower commissions and his or her market-maker edge. The strategy usually has a very low risk with a very high expectation of making a profit. The floor trader, because he or she is trading two spreads, is often able to scratch (that is, meaning to breakeven ) one spread and make a tick on the other or may scratch the whole butterfly spread.
Commodities also lend themselves to intercontract spreading. Let’s assume that you predict that copper prices are going to rise because of a supply shortage. If that is the case, then you would buy the nearby contract and sell the forward. This occurs because in times of shortages, nearby prices will rise above forward, creating a phenomenon called backwardation.
Always bear in mind when trading commodities that physical delivery is part of the contract specifications. Cash-and-carry is a strategy that can be used in trading metals – both base and precious – when they are in good supply. The idea is to take delivery of the metal in a warehouse and redeliver it at a future date if the return (the increase in price) will exceed the interest rate for that period of time. If the interest rate is more than the return or the return ends up being negative, then the strategy is not worth doing.
Intermarket spreading is another spread trading idea worth doing. Here you simply trade different markets against each other, such as the S&F versus the T-bonds, currency cross rates, gold versus silver, and so on. Indeed, Van has included a new section on intermarket analysis in this chapter, and John Murphy has devoted a whole book (Intermarket Technical Analysis) to the topic. The basic idea is that you would use such spreads because you believe that the relative move of the two markets is probably your best trading idea.
There are numerous forms of other spreads that you can look at, including (!) spreading options contract and (2) arbitrage, covered later in this chapter. Both of these are complete trading art forms by themselves. Spreading trading can be as simple or as complex as you life, but it is definitely worth investigating.
Editor’s Comments
All the previous concepts can be used with spreading. The advantage of spreading is simply that you can trade a relationship that was not tradable before. When you buy gold, for example, you are really buying the relationship between gold and your currency. The relationship will go up if either your gold goes up in value with respect to your currency. For example, in 2003 we seemed to have a rise in the price of gold. However, gold went up in 2003 only because the U.S. dollar went down and we were looking at gold prices in U.S. dollars. In contrast, the gold move in 2006 was in all currencies. Gold is actually going up while the dollar is going up.
A spread simply sets up another relationship that you can trade. It could be a stock priced in dollars or euros, or even the relationship between gold and oil prices.
Arbitrage
Ray Kelly was a close personal friend and one of my earliest clients. He was also a great teacher and one of the best traders I’ve known. From the time I finished working with him in 1987 until early 1994, Ray averaged returns of 40 to 60 percent each year. He accomplished that partially by having only one losing month, a mere 2 percent loss, during that entire period. Ray later retired to become a trader’s coach and to run a spiritual retreat center in Southern California. He has since passed away, and I find myself thinking of him often. Ray’s section is full of great humor and a great understanding of how the markets really work, so please read it and think of him with a smile as I do.
Ray Kelly : Arbitrage – What It is and How it’s Implemented
When people ask me what I do for a living and I say “arbitrage”, I see the same blank stare that I often use myself when I lift the hood of my car engine or someone utters the word “calculus.” Mothers gather their children to them, and men eye me with suspicion.
If you can overcome your fear of the “A” word for about 10 minutes, I guarantee that you will understand not only the essence of arbitrage but also he way it affects your everyday life. If you begin to “arb-think”, you will see opportunities in every facet of your life that you previously had ignored. Your knowledge will secure you from having to excuse yourself for the punch bowl at the next cocktail party when someone says “those arb guys.” You will be considered one of the intellectuals at the party, and people will stare at you in admiration – all because you invested 10 minutes in reading this section of this book.
Arbitrage is done by entrepreneurs in almost every business. The dictionary defines arbitrage as “the buying of bills of exchange in one market and selling them in another.” It also describes a woman as a “female human being.” Both of these definitions are true, but they don’t capture the essence of the word in total. Arbitrage is the magic of discovery. It is the art and science of delving into minute detail to the point of being obnoxious. It is the process of looking at every part of a situation as if it were a diamond slowly turning on a pedestal so you can observe all of its facets and see them as unique rather than the same. It belongs to those of you who love to solve the impossible riddle.
Arbitrage is the magic of discovery. It is the art and science of delving into minute detail to the point of being obnoxious. It is the process of looking at every part of a situation as if it were a diamond slowly turning on a pedestal so you can observe all of its facets and see them as unique rather than the same. It belongs to those of you who love to solve the impossible riddle.
Edwin Lefevre, in the book Reminiscences of a Stock Operator, describes what happened in the early 1920s with the advent of the telephone. All stock quotes from the New York Stock Exchange were sent out by teletyping houses that we now know as bucket shops. It was very similar to off-track betting. The shops allowed a person to know a quote and then place an order to buy or sell. The difference was that the shop owner was the bookie or regional specialist, and rather than call the exchange, he would book the trade himself. For example, the ticker would say Eastman Kodak trades for 661/2. The customer would say “Buy 500 shares,” and the shop owner would confirm the purchase and take the other side of this transaction.
A smart fellow with a phone finally figured out that the phone was faster than the Teletype operator on the floor of the New York Stock Exchange. He would transact some small trades to establish a presence with the shop but always kept in contact with a cohort by phone in times of volatility. If bad news came out, he may have found that Eastman Kodak, while on the tape at 661/2, was actually 65 at the post in New York. Consequently, he would sell shop owner as much as he could at 661/2 and buy it back through his friend on the floor in New York at 65. Thus, he made a sure $150 for every hundred shares. Over time, this clever fellow hired others to trade at the bucket shops and put many of them out of business. Eventually, the remaining bucket shops got their own phones.
Is this action unscrupulous, or is it a way to more efficiently price a marketplace? Is it unscrupulous for the shop owner to book the trades himself rather than put them in the name of the person who actually buys the stock? The important thing to remember is that economics per se does not have a good moral code. It simply is. People ascribe “good” and “bad” or “right” and “wrong” to various practices. The shop owner feels that the actions of the arb player are wrong. The New York broker loves the increased commission business and loves the arb player.
The important thing to remember is that economics per se does not have a good moral code. It simply is. People ascribe “good” and “bad” or “right” and “wrong” to various practices. The shop owner feels that the actions of the arb player are wrong. The New York broker loves the increased commission business and loves the arb player.
Arb players themselves feel that since the phone is open to everyone, they are only implementing something that any clever person could figure out. They do not feel an obligation to negate their cleverness by spelling everything out to those who could eventually figure it out for themselves. Over time, there are always actions of others to stop the arbs or to join in and make the opportunity less profitable. Economics is neutral to the emotions of the players. It says, “If there is money on the table, it belongs to the person who picks it up.”
When I was a teenager, I did my first arb. I lived in a wealthy neighborhood, although I was broke. My dad kept getting “free” credit cards in the mail. One day in the 1960s we had a blizzard as we do now and then in the Midwest. I lived across from a hardware store, and I knew that it had a snowblower for sale for $265. It was a beast of a blower! I could see that even the snowplows couldn’t get to the rich folk’s houres.
I also noticed an unopened letter with a Towne and Country Credit Card on my father’s desk. My name and my father’s are the same, so I took it. (This is what is called risk arbitrate.) I bought the snowblower with the credit card when the store opened at 7 a.m. I did 11 long driveways by 8 p.m. that night and made $550. The next morning at 7 a.m., I sold the snowblower back to the guy in the store for $200. He gave me back the credit card slip, and I gave him the slightly used snowblower, which was still in great demand. I netted $485 and felt like the cat that are the canary!
A few years ago I was approached for advice by a man who had 3,000 shares of stock. He had an opportunity to buy more shares through the company at a discount. This was a chance to buy a $25 stock for $19. Even though the amount of stock he could buy was small, it seemed like a good opportunity.
I had been on the Chicago Board Options Exchange (CBOE) for 25 years and could not find any comparable investments. As a result, I told him it was a good deal and called the company to find out more about its dividend reinvestment plan. I also found out that other companies had similar plans and that the brokerage community was starting to participate in these plans.
I wondered, “How are they doing this? If they bought a million shares, they would be able to reinvest only the amount of the dividend, and the interest on the purchase would wipe out the profit.” They also would have huge market risk. However, I saw others doing the trade, and I became obsessed with finding out how it was done. Some people were obviously making money. I dug through records, talked to margin clerks, and watched the trades that took place before the dividend payout dates. Slowly, the picture became clearer. I eventually solved the problem of what looked like a mathematical loser. However, I didn’t have enough capital to do it myself, so I went though the painful and agonizing steps to find a company in the securities business that was not doing it and would not steal it from me once I explained it to the people there. That was a long process.
An arbitrager must find a company that is willing to look beyond the obvious – that’s where the opportunity lies. Lawyers are usually a formidable wall of resistance. Lawyers for institutions are paid to investigate, and the status quo is normally hard to change. If something goes wrong, they are blamed. But if things drag out, the attorneys get paid anyway. If there is a little twist in the path, they are not paid to find another way, but just to tell you that the one you are on won’t work. They do not like being pressed for specifics, nor do they like quick answers. That is their charm. On the other hand, once you get through the process, you become part of the status quo (at least, for a little while).
Arbitrage is usually time-sensitive. Once certain opportunities are discovered, competition usually lowers the profits, and regulators eventually plug the once overlooked loophole. This time frame is usually referred to as “the window.” A company that ha a dividend reinvestment plan, for example, may say, “We meant this plan only for small investors.” The arbitrager may respond that the intentions of the company are not part of the legal text of its plan. The company, in turn, will usually seek remedy through legislation or by changing its plan. In either case, the arbitrage opportunity pointed to a flaw in the economics of the company’s “intent.” The arb player is paid by that flaw.
The institutions I have presented ideas to over the years have a problem called “infrastructure.” Large companies are broken into divisions that manage specific parts of their business. In the securities area, one group may handle customer accounts, another will handle stock lending, another will handle proprietary trading, and so on. Each division has its own profit goals and what is called a hurdle rate. The hurdle rate is a computation of the minimum return the division head will accept to entertain a business proposal.
The CEO will usually turn management over to the division head. The problem here is that the economy (and the opportunity) doesn’t care about the corporation’s structure. What is perhaps efficient from a corporate viewpoint may leave inefficiencies that are accepted as a cost of doing business. Since it is anathema for one corporate division head to peek into another manager’s area, these inefficiencies are rarely addressed quickly, if at all.
In a specific and actual situation, I presented one major brokerage firm with a strategy that returned 67 percent on capital net after my percentage were taken out. Unfortunately, I needed three divisions of the company to accomplish this. Each of these divisions had a 30 percent hurdle rate. Non e of them would take less because it weakened the individual division’s overall picture even though it greatly enhanced the overall return to the company. During almost two years of negotiation the return went from 67 percent down to 35 percent. There were literally tens of millions of dollars of potential profit at stake. The company never did a trade, and to my knowledge all the same managers still work there.
Once you get through the infrastructure and gain credibility with a firm, there are other problems. The troops in the trenches get irritated because nothing you do is normal. They are always asked to do things somewhat differently for me than they do for their regular customers. We insist on minute-to-minute concentration on little, seemingly innocuous procedures.
For example, if a trade is executed on the New York Stock Exchange, I can negotiate a fixed ticket charge of say $150 regardless of the size of the trade. I cannot help my client negotiate with the Securities and Exchange Commission on its 0.003 percent charge on the sale of the stock. This seems to be a small amount of money. But on a $100 million trade, the amount is $3,333.33. To me, that is a lot of money.
A brokerage firm cannot charge the U.S. government. It simply passes the charge on to the customer, and such charges go unchallenged. Yet if my client were to do 1,000 of these $100 million trades each year, the government charge would be over $3 million. Once again the economy of the opportunity does not concern itself with the intransigence of policy – even from the U.S. government. Yet if I suggest to my client that should she transact her trade in Toronto rather than the United States, she would save this fee, be reasonably free from questioning by governmental authorities, and not get any notoriety domestically, the client loves me. The clerk who has to process these trades, however, doesn’t love me at all. I have upset his day with what he sees as trivia. If I were to cut him in on 10 percent of the saved free, the light would dawn quickly. But the more I disclose information to people, the quicker the advantage goes away.
Eventually, others will figure out what I am doing and find a way to cut themselves in on the profit. This is called reverse engineering. Some firms have whole divisions that dedicate themselves to my belief that this process is a critical part of price discovery in the economic system. The arbitrager points out, in a way that can’t be ignored or pushed back by bureaucracy, some miscalculation or misperception. In many cases, it forces institutions to look at situations they would otherwise ignore.
I am still dumbfounded by all the precautions that securities firms and banks seem to take – yet they still come up with billion dollar snafus. The process of strategy approval is so rigorous that the arbitrage players who do the trading have no incentive to help their own corporations in risk evaluation. The arbitragers almost invariably wind up in an adversarial role by the nature of their business. The integrity of the trader should be heavily considered in all aspects of the trader’s life. Integrity seems to be the last line of defense of most trading companies.
Your mission through arbitrage, is to correct inefficiencies whether people want you to or not. You get paid to correct errors. Your jobs is to pick apart the strategy or concept of someone else piece by piece. If you don’t find anything, which is usually the case, you simply move on to another strategy or concept.
In conclusion, the case could be made that there is no stability to a career in arbitrage since everything always changes – the loopholes close and the profits become smaller. On the other hand, you can realize that everything in life changes constantly, and accepting that change is to live a grand adventure. You can realize that errors and miscalculations are part of human condition. They are how we learn and grow. Your mission, through arbitrage, is to correct inefficiencies whether people want to or not. You get paid to correct errors. Your job is to pick apart the strategy or concept of someone else piece by piece. If you don’t find anything, which is usually the case, you simple move on to another strategy or concept. The way you view things, your frame of reference, determine your view of arbitrage.
The arbitrager’s success is determined by his or her commitment to go the extra distance. Arbitrage is the cleanser of inefficiency. It keeps me from being a spectator. After all, there are only two places you can be in life – on the playing field or in the stands. I prefer to be on the playing fields.
Editor’s Comments
In essence, most trading and investing is a form of arbitrage – looking for inefficiencies in the market. Arbitrage keeps prices in line and really allows markets to be somewhat orderly. Ray Kelly’s form of arbitrage, however, is the purest application of arbitrage. It’s almost a license to print money, but for a limited period of time. If you are really serious about being a professional trader, then I strongly agree that you continually look for such opportunities. Each opportunity, when found and exploited properly, could be worth millions of dollars to you.
Intermarket Analysis
In the last edition of Trade Your Way to Financial Freedom, I included a section by Lou Mendelsohn on neural networks. However, neural networks is really not a trading concept but rather a method of analyzing the markets. As a result, I elected to drop that section from this edition. What might be considered a concept, however, is what neural networks can do, and that is to show the relationships between markets. And that might be considered a concept for trading. Furthermore, given my belief that the economy is now becoming a global economy, understanding the relationships between markets is becoming more and more important. Louis Mendelsohn is also an expert on intermarket analysis, so I requested that he write a new section on this interesting topic.
Louis B. Mendelsohn: Intermarket Analysis
If you look at a restaurant menu and see filet mignon priced at $27.95, you may decide that’s a bit too expensive for your taste. So you choose the lamb chops at $21.95 or maybe even the chicken at $15.95.
Welcome to the world of intermarket analysis. Knowingly or not, you are probably making the same types of choices every day that corporate executives make when they decide whether to heat their offices or factories with natural gas or heating oil if they have the flexibility to choose). Or farmers make when they look at input costs and market prices in determining whether to plant corn or soybeans. Or investors make when they analyze returns from small-caps compared to big-caps or from one market sector versus another or between international and domestic stocks.
No Isolated Markets
No individual market operates in an vacuum, especially in today’s global, 24-hour, electronically traded marketplace where one market is quickly influenced by what happens in other related markets. While many traders look backward at historical prices to gauge how a market’s past behavior might suggest how that market will play out in the future, they also need to look sideways to detect the impact that prices in other markets have on the price of the market they are trading.
Intuitively, most traders know that markets are interrelated and that a development that affects one market is likely to have repercussions in other markets. However, many individual traders still limit themselves to using single-market analysis tools and information sources that have been around since the 1970s when I first started in this industry.
Although there has long been general awareness of intermarket relationships, the difficulty is in quantifying these relationships in terms that traders can use in making their decisions. My research since the mid-1980s has focused on developing a quantitative approach to implement intermarket analysis. It is neither a radical departure from traditional single-market technical analysis nor an attempt to replace it.
Intermarket analysis, in my opinion, is just an expansion of traditional single-market technical analysis, given the global context of today’s interdependent economies and financial markets. Especially in markets such as foreign exchange, which provide the pricing basis for other markets, you have to adopt an approach that incorporates intermarket analysis on one way or another. An important aspect of my ongoing research involves analyzing which markets have the most influence on each other and determining the degree of influence these markets have on one another.
“Hurricaneomics”, a concept that I coined in 2005, is a perfect example of the interconnectedness of events and markets and how nothing can be looked at in isolation. The spate of hurricanes that hit the Gulf Coast and Florida in 2005 did not simply cause local damage to the economy of those regions. On the contrary, hurricaneomic effects will ripple throughout the world economy for months and years to come, impacting the energy markets, agricultural markets, construction industry, the federal deficit, interest rates, and of course, the forex market. Hurricaneomic analysis goes hand in hand with intermarket analysis in looking at events such as natural disasters and their effects on the global financial markets.
Discovering Market Impacts
Research in my ongoing development of VantagePoint Intermarket Analysis Software began when it was first introduced in 1991. That research indicates that, if you want to analyze the value of the euro versus the U.S. dollar (EUR/USD), for instance, you not only have to look at euro data but also at th