We typically trade our beliefs about the market, and once we’ve made up our minds about those beliefs, we’re not likely to change them. And when we play the markets, we assume that we are considering all of the available information. Instead, our beliefs, through selective perception, may have eliminated the most useful information.
Van K. Tharp, Ph.D.
You now understand that the search for the Holy Grail system is an internal search. This chapter will help you in that search by helping you take the first step, that of becoming aware of what might be holding you back. And the miracle is that when you have such awareness and accept that you are in charge of your life, then you also have the ability to change.
Overall, a basic source of problems for all of us is the vast amount of information we must process regularly. French economist Georg Anderla has measured changes in the rate of information flow with which we human beings must cope. He bas concluded that information flow doubled in the 1,500 years between the time of Jesus and Leonardo da Vinci. It doubled again by the year 1750 (that is, in about 250 years0. The next doubling took only about 150 years to the turn of the century. The onset of the computer age reduced the doubling time to about 5 years. And, with today’s computers offering electronic bulletin boards, DVDs, fiber optics, the Internet, and so on, the amount of information to which we are exposed currently doubles in about a year or less.
Researchers estimate that humans, with what we currently use of our brain potential, can take in only 1 to 2 percent of the visual information available at any one time. And for traders and investors the situation is at an extreme. A trader or investor, looking at every market in the world simultaneously, could easily have about a million bits of information coming at him or her every second. Many traders have two to four computer screens operating simultaneously. And since there are usually some markets open around the world at all times, the information flow does not stop. Some misguided traders actually stay glued to their trading screens, trying to process as much information as possible for as long as their brain will permit.
The conscious mind has a very limited capacity to process information. Even under ideal conditions, that limited capacity is between 5 and 9 chunks of information at a time. A “chunk” of information could be one bit, or it could be thousands of bits (for example, a chunk could be the number 2 or the number 687,941). For example, read the following list of numbers, close the book, and then try to write them all down:
6, 38, 57, 19, 121, 212, 83, 41, 917, 64, 817, 21
Could you remember all the numbers? Probably not because human beings can consciously process only 7 plus or minus 2 chunks of information. Yet we have millions of bits of information coming at us every second. And the current rate of information availability is now doubling every year. How do we cope?
The answer is that we generalize, delete, and distort the information to which we are exposed. We generalize and delete most of the information – “Oh, I’m not interested in he stock market.” That one sentence takes about 90 percent of the information available on the markets, generalizes it as “stock market information,” and then deletes it from consideration.
We also generalize the information we do pay attention to by being selective: “I’m going to look at only the daily bar charts on markets that meet the following criteria.” We then have our computers sort the data according to those criteria so that an incredible amount of information is suddenly reduced to several lines on a computer screen. Those few lines are something we can process in our conscious minds.
Most traders and investors then distort the generalized information that remains by representing it a an indicator. For example, we don’t just look at the last bar. Instead, we think the information is much more meaningful in the form of a 10-day exponential moving average or a 14-day RSI or a stochastic, or a bad or trendline, and so on. All of these indicators are examples of distortions. And what people trade are “their beliefs about the distortion” – which may or may not be useful beliefs.
Psychologists have taken a lot of these deletions and distortions and grouped them together under the label “judgmental heuristics.” They are called “judgmental” because they affect our decision-making process. They are called “heuristics” because they are shortcuts. They allow us to sift through and sort out a lot of information in a short period of time. We could never make market decisions without them, but they are also very dangerous to people who are not aware that they exist and who are also unaware that they use them. They effect the way we develop trading systems and make decisions about the market.
The primary way most people use judgmental heurists is to preserve the status quo. We typically trade our beliefs about the market, and once we’ve made up our minds about those beliefs, we’re not likely to change them. And when we play the markets, we assume that we are considering all of the available information. Instead, we may have already eliminated the most useful information available by our selective perception.
Interestingly, Karl Popper points out that progress in knowledge results more from efforts to find fault with our theories than from efforts to prove them. If his theory is true, then the more we tend to realize our beliefs and assumptions (especially about the market) and disprove them, the more success we are likely to have making money in the market.
The purpose of this chapter is to explore how such judgmental heuristics or biases affect the process of trading or investing. First, we’ll cover biases that distort the process of system development. Most of the biases covered fall into this category. However, some of them affect other aspects of trading as well. For example, the gambler’s fallacy affects trading system development because people want systems that don’t have losing long streaks, but it also affects how the system is traded once it is developed.
Next, we’ll cover biases that affect how you test trading systems. For example, one gentleman, when exposed to some of the information contained in this book, claimed that it is full of controversy and that key elements were left out. Those statements, however, were just projections coming from him. There is no conflict within the material presented in this book – it’s just information. Thus, if you perceive such controversy, it is because that controversy is coming from you. In addition, some steps that most people do in system development are left out, but they are left out intentionally because my research shows that they are not important or they are more of a hindrance (than a help) to the development of a good system.
Last, we cover a few biases that might affect how you trade the system you’ve developed. Although this is a book about doing trading system research, the biases included here are important because you need to consider them when you are doing your research before you actually start trading. I’ve deliberately kept this part of the chapter to a minimum, however, because those biases are covered in much more detail in my home study course for traders and investors.
Biases That Affect Trading System Development
Representation Bias
Before you think about trading systems, you have to represent market information in such a way that your brain can cope with the available information. Look at the chart in Figure 2.1. It illustrates a typical bar chart, which is how most people think about market activity. A daily bar chart, as shown in the illustration, takes a day’s worth of data and summarizes it. That summary includes, at most, four pieces of information – the open, the close, the high, and the low.
Japanese candlestick charts make the information a little more obvious and also give you visual information about whether the market generally moved up or down. As shown in Figure 2.2, the fat part of the bar (the body) represents the difference between the open and the close, whereas the extreme tails (the wicks) represent the high and the low. Candlesticks are generally solid if the market goes down and clear if it goes up, making it easier to see what happened.
The two daily bar charts Figure 2.1 and 2.2 are good examples of the first heuristic, which everyone uses, called the law of representation. What it means is that people assume when something is assigned to represent something, it really is hat it is supposed to represent. Thus, most of us, just look at the daily bar and accept that it represents a day’s worth of trading. In reality, it’s just a line on a piece of paper – no more and no less. Yet, you probably have accepted that it is meaningful because
- You were told it was meaningful when you first started studying the markets.
- Everybody else uses daily bars to represent the markets.
- When you purchase data or get free data, they are typically in daily bar format.
- When you think about a day’s worth of trading, you typically visualize a daily bar.
The bar chart in Figure 2.1 and the candlestick chart in Figure 2.2 only show you three things. First, they show the range of prices that occurred throughout the day. Second, they show a little bit about how prices moved – they moved from the open to the close (plus some variations for the high and the low). And third, the Japanese candlesticks make the overall movement that day clear through the shading.
What doesn’t a typical daily bar show you? A daily bar doesn’t show you how much activity occurred. It doesn’t show you how much activity occurred at what price. It doesn’t show you when during the day the underlying commodity or equity was at a given price (except at the beginning or the end). Yet this information might be useful to traders or investors. You can get some of this information by lowering the time frame and looking at five-minute bars or tick charts. But wait: Wasn’t the purpose of the daily bar chart to reduce the information flow so you are not overwhelmed?
There is a lot of other information that might be useful to traders that is not shown in the daily bar chart. In the case of futures, did the transactions involve opening up new contracts or closing out old ones? What kinds of people were doing the trading? Did a handful of floor traders trade with each other all day long, trying to outguess and outmaneuver each other? How much of the activity was in the form of a single unit (100 shares of stock or a single commodity contract)? How much of the activity was in large units? How much was bought and sold by mutual fund portfolio managers or managers of large commodity funds? How much was bought or sold by hedgers or big companies?
And there is a third class of information hat is not represented in the daily bar chart – who’s in the market. For example, how many people are currently holding long or short positions? What is the size of their positions? That information is available, but it is generally not easily accessible. The various exchanges, with the kind of computers available today, could store and report information like this each day:
The price moved from 83 to 85. There are 4,718 investors holding long positions, and the average position size is 200 units. During the day, long positions increase by a total of 50,600 units. There are 298 investors holding short positions with an average position size of 450 units. Short positions increased by 5 units. The top 100 positions are held by the following people and their position is ……… [followed by a listing].
Perhaps, you’re saying, “Yes, I’d like to know who owns what and how large their positions are.” Well, if you had hat information, would you know what to do with it? Would it be any more meaningful? Probably not – unless you have some beliefs that would allow you to trade it.
The daily bar chart also does not give you any statistical probabilities – given that X happens, what is the likelihood of Y? You can use historical data to determine the likelihood of Y, but only if variable X (and Y, for that matter) is contained in your data. But what if X or Y is interesting but not contained in your data?
Finally, there is another, critical type of information that is not included in a simple daily bar – psychological information. That information involves the strength of conviction of the long positions and the short positions. When would various traders be likely to liquidate and at what price? How will they react to various news items or price movements? And how many people are sitting on the outside of the market with the belie that it is going up or the belief that it is going down? Are they likely to convert those beliefs into market positions and under what conditions? And if they did, at what price and how much money are they likely to have behind them to back their positions? But even if you had this information, do you have beliefs that would help you make money from it?
Until now, you’ve probably thought that a daily bar chart really was the market. Remember, all you’re really looking at is a single line on your computer or chart book. You are assuming that it represents the market. You might call it a generalization about the market’s activity in a given day, but that is the best you can call it. The scary thing is that a daily bar chart, which is at best summary information, is typically the raw data that you manipulate to make your decisions.
The scary thing is that a daily bar, which is at best summary information, is typically the raw data that you manipulate to make your decisions.
I hope that you’re beginning to understand why judgmental heuristics are important to you as a trader – and all I’ve given you is just one example of one heuristic, the tendency we have to assume that a bar chart really represents a day’s worth of market activity.
You could just trade bar charts. But most people want to do something with their data before they trade, so they use indicators. Unfortunately, people do the same thing with market indicators. They assume they are reality rather than just attempts to represent something that might occur. RSI, stochastics, moving averages, MACD, and so on – all seem to take on a reality, and people forget they are merely distortions of raw data that are assumed to represent something.
For example, think about the technical concept of support levels on a chart. Originally, technicians observed that once prices dropped to a certain area on the chart, they seemed to bounce back. That area was then assumed to be a level at which a lot of buyers were wiling to buy and thus “support” the price of the stock. Unfortunately, many people treat words like support level and resistance level as if they were real phenomena rathe than simply concepts that represent relationships that people have observed in the past.
I’ve previously talked about the representativeness bias in the sense that people tend to judge something by what it “looks like” as opposed to what its probability rate is. This is especially important in terms of using a trading system or trading signal. Have you considered probability rate information in developing your trading system or assessing the validity of your signals? That is, do you consider the percentage of time that your predicted outcome follows your signal? Probably not, because I don’t know 1 trader in 1,000 who does that – even though I tell people about it constantly. What this means is that most people don’t even test their systems or know the expectancy of their systems.
Now let’s discuss a few more biases. We’ll determine what these additional biases might do to your thinking about the markets and trading system development.
Reliability Bias
A bias related to the representation bias is the assumption that our data are reliable – that they really are what they are supposed to be. With respect to the daily bar chart, we just commonly assume that it represents a day’s worth of data. It looks like a day’s worth of data so that’s what it must be. However, many data vendors combine day data and night data, so is it really a day’s worth of data? And what about the accuracy of the data?
Seasoned traders and investors know that gauging data reliability is one of the worst problems that traders can have. Most data vendors are fairly accurate with respect to daily bar charts, but when you start using tick data, 5-minute bars, 30-minute bars, and so on, accuracy goes out of the window. Thus, if you are testing a system based on 5-minute bars, most of your results (good or bad) could have more to do with inaccurate data rather than real expected results.
Look at the story in the sidebar about the problems one can have with data. It’s a personal story from Chuck Branscomb that appeared in one of our newsletters.
Once you’ve read the story, you can understand how most people accept a lot more about the market than is true. All is not as one would expect. And when you think you have a good system, you could simply have poor data that makes it look good. Conversely, you might think that you have a bad system when you really have poor data that makes a good system look bad.
Bet let’s assume that you are accepting the fact that daily bar charts really do represent the market. You wish to accept that generalization and trade it. That’s fine, but let me show you how many more biases probably creep into your thinking.
A Personal Story From Chuck Branscomb
I trade a portfolio of 16 futures markets using a system of my design. I use portfolio trading system software to run my system code against daily data to generate orders each night. The basic entry and exit rules are programmed into a real-time software program so that I am alerted when I have taken when I have taken a position in a market.
On July 10, 1995, I had correctly placed all of my entry and exit orders for the portfolio prior to the open. Shortly after the Chicago currency markets opened, the real-time software alerted me to a long entry in the Canadian dollar. I was shocked since I hadn’t even generated an order for the Canadian dollar that day. I just stared at the screen for a few seconds in disbelief. Having mentally rehearsed being shocked by an unexpected market occurrence, I automatically fell into my rehearsal scenario: take a deep breath, relax all my muscles from forehead to toe while exhaling, and create a systematic process of checking for errors from highest to lowest probability.
It took just a couple of minutes to find that the low for the previous day was different between the data I had downloaded for my portfolio software to run against versus that collected by my real-time software. A quick check of the previous day’s tick data confirmed my suspicion: the data the portfolio system used were invalid. I quickly edited the database manually and reran the program. It now generated an entry order. I glanced at the screen to see that the market had now rallied well above my entry point. I had feelings of frustration running through me, but I calmly inputted the information from the program into my portfolio manager spreadsheet to size the position. Looking at the screen, I saw the market up yet another 5 ticks now that I had the order ready. My reaction at that point was totally automatic and focused: I called my trade desk and placed an order to enter the position at the market.
This whole process consumed about 10 minutes’ time during which the Canadian dollar rallied further and further away from my intended entry price. Fortunately, mental rehearsal saved me from second-guessing what to do. My trading objectives include not ever missing a trade entry since I have no idea when a monster move may be evolving. Missing out on a substantial winning trade is far worse than simply taking a small loss. When I knew I should be in that market already, the phone call was an automatic, focused response. For the type of trading that I do, it was the right thing to do. I have no use for hoping the market will come back to the entry point or second-guessing whether to follow through on the entry.
This occurrence marked the need for me to create a procedure that would force a disciplined checking of daily data for each futures contract. Up to that point, I thought that I was doing a sufficient job of screening daily data. I had caught many errors in the past, but I now knew that I needed to crate yet another work for myself each day to ensure that I could trade my business plan as designed.
Lotto Bias
The lotto bias relates to the increased confidence people have when they, in some way, manipulate data – as if manipulating that data is somehow meaningful and gives them control over the market. Now that you’ve accepted the daily bar chart as your way of representing the market, you must either trade daily bars or manipulate them in some way until you feel confident enough to trade them. But of course the data manipulation itself often can and will give you this increased confidence.
A perfect example of how this illusion of control works is the state-run lottery game called lotto . When you play the lotto, you get to pick some numbers (usually six or seven of them), and if you happen to hit all of them, you become an instant millionaire. People really like to play the lotto game (even logical people who understand the odds). Why? Because the prize is so big and the risk so small (a dollar ticket is small compared with the size of the prize) that people are drawn to play. It doesn’t mater to them that the odds are so stacked against them that if they bough a million tickets (each with with different numbers), they still would not be likely to win. Your chance of winning $1 million in a state-run lottery is about 1 in 13 million (and the odds are much worse if you expect to win more).
The big prize for such a small amount of money is also a heuristic, but it’s not the lotto bias. The lotto bias is the illusion of control that people get when they play the game. People think because they get to pick the numbers that their odds of success ae somehow improved. Thus, some people might suspect that if they picked the numbers in their birthday and their anniversary, it might improve their chances for winning. For example, some years ago a man whom the jackpot in the Spanish national lottery. He won it because of his interpretation of his dreams. It seems that he dreamt about the number 7 for 7 straight nights. Since he mistakenly thought that 7 times 7 was 48, he selected a ticket with the numbers 4 and 8 on it.
Others, rather than using their dreams, consult with psychics or astrologers. In fact, you can purchase all sorts of advice to help you win the lotto. Some people who have analyzed the numbers thinking they can predict subsequent numbers are quite wiling to sell you their advice. Others have their own lotto machines and believe that if they generate a random sequence of numbers, it might just correspond to what the state-controlled lotto machine might select. They are also willing to sell you advice. And if some guru or astrologer claims to have several jackpot winners (a distinct possibility if the person has enough followers), then many more people will be attracted to that person. People will do anything to find the magic numbers.
If this seems a little familiar, it should be. This is exactly what occurs in speculative markets. People believe they can make a quick dollar by picking the right numbers. Picking the right numbers, in the case of speculators and investors, means that they simply know what to buy and when. The most important question the average person wants to know is, “What should I buy right now that will make me a fortune?” Most would rather have someone tell them what to do.
People do everything they possibly can to figure out what to do right now. They buy software that picks numbers and analyzes tendencies. Brokers have found that if they help them pick numbers, by reading off entry points on radio and television shows, thousands of people will want their advice. If you are known to publicly give advice, no matter how accurate (or inaccurate) that advice is, people will consider you an expert. In addition, there are plenty of gurus who are good at promoting and are more than happy to tell people in their newsletters what to buy and when. And of course, astrologers and fortune tellers also play a role in this process.
Some people get the notion that perhaps they would be better off on their own. Consequently, they become fascinated by entry signals that they perceive to be synonymous with a complete trading system. You get a sense of control with entry signals because the point at which you choose to enter the market is the point at which the market is doing exactly what you want it to do. As a result, you feel as though you have some control – not just over your entry but over the market. Unfortunately, once you are in a position in the market, the market is going to do whatever it wants to do, and you no longer have any control over anything except your exits.
I’m at what people consider a trading system! For example, one gentleman visited me from Australia some years ago. He’d been talking with various experts all over the United States about what kind of trading systems work. At dinner one nigh, he told me what he’d learned and showed me the “guts” of the various systems he’d discovered so that I could give him my blessing. He had some great ideas. Yet all of his trading systems, as he relayed them to me, had to do with entry techniques. In fact, the only thing he described about each trading system was the entry. My comment was that he was on the right track, but if he’d now spend at least as much time working on his exits and position sizing, the he’d really have a good system.
Most people believe that they have a trading system if they have some sort of entry point that makes them money. As you’ll learn later in this book, there are as many as 10 components to a professional trading system and the entry signal is probably the least important. Nevertheless, most people just want to know about entry.
I was a speaker at an international conference on technical analysis of futures and stocks in Malaysia in 1995. There were about 15 speakers from the United States, and we got rated on our performance. The speakers with the highest ratings talked mostly about entry signals. And the one speaker who talked about the various components of a trading system, and whose talk was therefore very valuable, received much lower ratings.
I attended one of the more highly rated talks. The speaker was a brilliant trader who was up about 76 percent in his account in 1994 with only a 10 percent drawdown. Yet what he talked about were mostly signals for picking changes in a trend. He presented six to eight such signals in his talk and mentioned something about exits and money management when people asked him. Later, I asked him if traded all of those signals. His response was ,”Of course not! I trade a trend-following signal. But this is what people want to hear, so I give it to them.”
One of my clients, upon reading this, made the following observation: “I have always felt that this ‘lotto bias’ is a way of dealing with the anxiety of not feeling in control. Most people would rather pretend to be in control (and be wrong) than feel the anxiety of having no control over the environment in which they must exist. The big step is in realizing that ‘I have control over my actions.’ And that is enough!”
This bias is so powerful that people frequently do not get the information they need to prosper in the market. Instead, they get what they want to hear. After all, people typically make the most money giving people what they want rather than giving them what they need. This book is an exception to that rule. And, hopefully, there will be a number of such exceptions in the future.
Law of Small Numbers
The pattern shown in Figure 2.3 could represent another bias for some people. There are four days in which the market does nothing (within the first five days shown), followed by a big rise. If you peruse some chart books, you might find four or five examples like that. The law of small numbers says that it doesn’t take many such cases for you to jump into conclusion. For example, let’s enter the market when we have four days in a narrow range followed by a big jump in prices.
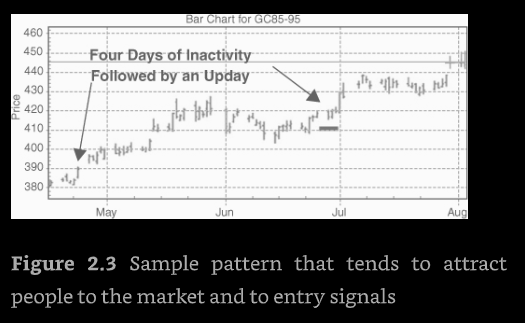
In fact, my observation is that most people trade by following the patterns they observe in a few well-chosen examples. If you see a pattern like the one shown in Figure 2.3, followed by a large move, then you assume that the pattern is a good entry signal. Notice that all four biases discussed so far have entered into this discussion.
The following quote from William Eckhardt really describes this bias well:
We don’t look at data neutrally – that is, when the human eye scans a chart, it doesn’t give all data points equal weight. Instead, it will focus on certain outstanding cases, and we end to form our opinions on the basis of these special cases. It’s human nature to pick out the stunning successes of a method and to overlook the day-in, day-out losses that grind you to the bone. Thus, even a fairly careful perusal of the charts is prone to leave the researcher with the idea that the system is a lot better than it really it.
Scientific research knows about this kind of bias. Even the most careful researcher will tend to bias his or her result toward his or her hypothesis. That’s why scientists have double-blind tests – tests in which the experimenter does not know which group is the experimental group and which group is the control group until the experiment is over.
Conservatism Bias
Once we have a trading concept in mind, the conservatism bias takes over: we fail to recognize or even see, contradictory evidence. The human mind is quick to see the few outstanding examples of moves that work while avoiding or ignoring examples that don’t work. For example, if you looked at a lot of data, you might find that the pattern in Figure 2.3 was followed by a large move 20 percent of the time. The rest of the time nothing significant happened.
Most people totally ignore the contradictory evidence, despite the fact that it is overwhelming. However, after seven or eight losses in a row, they suddenly begin to be concerned about the validity of their trading system without ever determining how many losses could occur.
If the move that occurs 20 percent of the time is large enough, then it is still tradable – but only if you are careful to cut losses short during the 80 percent of the moves when nothing happens. But, of course, that points out the importance of the lotto bias. If you just concentrate on the pattern, you probably won’t make money.
The implication of this bias is that people search out what they want, and expect, to see in the market. Most people, as a result, are not neutral with respect to the market, and they cannot go with the flow. Instead, they are constantly searching for what they expect to see.
Randomness Bias
The next bias influences trading system development in two ways: First, economics and many investors tend to assume that the market is random – that prices tend to move according to random choice. Second, people make erroneous assumptions about what such randomness, if it exists, might meant.
One reason people like to pick tops and bottoms is that they assume the market can, and will, turn around at any time. Basically, they assume that the market is random. Indeed, many academic researchers still hold the belief that the market is random. But is that assumption correct? And even if the assumption is correct, could people trade such a market?
The market may have characteristics of randomness, but that does not mean it is random. For example, you can generate a series of bar charts using a random number generator. When you look at those bar charts, they look like bar charts. But this is an example of the representativeness bias, and “looking like random” is not “being random.” These kinds of data are unlike market data because the distribution of prices in the market has extreme tails that you could never predict from normally distributed random prices. Why? When you look at market data, the sample variability just gets larger and larger as you add more data. The 80-point drop in the S&P that occurred on October 19, 1987, within a decade of the inauguration of the S&P futures contract, would be difficult to predict form a random number series. It might occur once in 10,000 years, but that event occurred in our lifetime. Moreover, it has happened again. On October 27, 1997, the S&P had a drop of 70 points, and on the next day, it had a daily range of 87 points. Similarly, the Nasdaq had several huge one-day drops during 2000 to 2002.
The fact that market price distributions tend to have an infinite variance, or nearly so, suggests that more extreme scenarios than you might imagine are right around the corner. As a result, any derived estimate of risk will be significantly underestimated. And unfortunately, most people take way too much risk in the market. When a market wizard like Tom Basso claims that risking as much as 3 percent of your equity on a single position is being a “gunslinger”, it suggests that most people are really crazy in the amount of risk they take.
Even if the markets were random, people fail to understand randomness. When a long trend does occur in a random sequence, people assume that it is not random. They develop theories to suggest that it is something other than a long series in a random sequence. This tendency comes from our natural inclination to treat the world as if everything were predictable and understandable. As a result, people seek patterns where none exist and assume the existence of unjustified causal relationships.
One consequence of the randomness bias (and the lotto bias) is that people tend to want to pick tops and bottoms. We want to be “right” and have control over the market, and we project our ideas onto the market. The result tends to be a belief that we can pick tops and bottoms. This seldom occurs in the life of a trader or an investor. Those who attempt to do it are doomed to many experiences of failure.
Need-to-Understand Bias
The need-to-understand bias enters into how mot people develop trading systems. They totally ignore the randomness element. In fact, they don’t even consider position sizing as part of their system.
One of my clients, Joe, claimed that he had the most difficulty with the market when he got into a position and got confused. As a result, I asked him a number of questions. “How often are your positions winners?” His response was that he was right about 60 percent of the time. “When you get confused, how often d you come out a winner?” This time his response was that he almost never came out a winner when he got confused. I then said, “Since your system isn’t much above chance, you probably don’t understand that much about the markets anyway. But when you clearly are confused, you should get out.” He agreed it was probably a good idea.
When you think about Joe’s trading system, however, he really didn’t have one. Why? Joe was so concerned about understanding every aspect of the market that he didn’t have clearly defined exit signals that told him (1) when he should get out to preserve his capital (2) when he should take his profits.
Most people still need to make up elaborate theories about what is going on in the markets. The media are always trying to explain the market even though they know nothing about the market. For example, when the Dow Jones plunges over 100 points, the next day the newspapers are filled with numerous explanations. Here’s what you might read in your local paper:
A late Wednesday warning from the Federal Reserve that it might raise interest rates unnerved investors Thursday. Stocks plunged, especially building companies, on fears of on industry-wide earnings slowdown. In today’s market climate, investors seem to be particularly nervous whenever they think interest rates might rise. Investors are also concerned about the impact of what is going on in the Middle East. Any sign of trouble and investors start to get very nervous.
The next day the Dow Jones Industrials might go up more than 100 points. You’ll probably read something like the following:
Wall Street, which was getting nervous over a potential interest rate hike, shook off the rumor and plunged into the market again as the Dow Jones Industrials rose over 100 points. R.P. Jinner, of H.P. Mor Securities commented, “Earnings have been so good recently that investors seem to easily shrug off potentially damaging news.”
The need-to-understand bias becomes even more elaborate when it comes to trading system design. People manipulate daily bars in any number of strange ways and then develop strange theories to explain the market based upon those manipulations. The resulting theories then take on a life of their own, but they have little basis in reality. For example, what is the rational basis for the Elliot Wave theory? Why should the market move in three legs one way and two legs the other?
Are you beginning to understand why the task of trading system development is so full of psychological biases? My experience is that most people will not be able to deal with the issues that come up in trading system design until they’ve solved some of their personal psychological issues dealing with fear or anger. Furthermore, some people don’t even want to resolve such issues – in fact, some people probably skipped this section just to get to the real material on system development.
Biases That Affect How You Test Trading Systems
Our next series of biases affect the testing of trading systems. Most people never encounter these biases because they never get to the point of testing systems. Actually, the conservatism bias, discussed earlier in this chapter, would stop most people from ever testing a system. And more importantly , most people never get to the point where they even have a testable system. However, for those who do get to this point, the result of these next biases can be insidious.
Degrees-of-Freedom Bias
A degree of freedom is a parameter that yields a different system for every value allowed. For example, a moving average based on 10 days will yield different results from a moving average based on 24 days. Thus, the length of a moving average represents 1 degree of freedom. People tend to want as many degrees of freedom as possible in their systems. The more indicators you add, the better you can describe historical market prices. The more degrees of freedom you have in a system, the more likely that system will fit itself to a series of prices. Unfortunately, the more a system fits the data upon which it was developed, the less likely it will be to produce profits in the future.
System development software (most of it, that is) really encourages the degrees-of-freedom bias. Give a system developer enough leeway and that person will have a system that perfectly predicts the moves in the market and makes thousands of dollars on paper – with certain historical markets, that is. Most software allows people to optimize to their heart’s content. Eventually, they will end up with a meaningless system that makes a fortune on the data from which it was obtained but performs miserably in real trading.
Most system development software is designed to cater to this bias. People want to know the perfect answer to the markets. They want to be able to predict the markets perfectly. As a result, you can buy software now for a few hundred dollars that will allow you to overlay numerous studies over past market data. Within a few minutes, you can begin to think that the markets are perfectly predictable. And that belief will stay with you until you attempt to trade the real market instead of the historically optimized market.
No matter how much I mention this bias, most of you will still give into it. You’ll still want to optimize your system as much as possible. As a result, let me give you several precautions in such optimization. First, understand the concept you are using so well that you will not even feel the need to optimize. The more you understand the concept you are trading, the less need you have to do historical testing.
Second, I would strongly suggest that you imagine various scenarios that might happen in the market. For example, you might imagine the next war, a nuclear terrorist attack, the adoption of the euro as the world’s reserve currency, the adoption of a common currency in Asia, China joining Japan to become a common power, or an unemployment report that jumps 120 percent. Some of these ideas might seem valid, but if you can understand how your system concept would handle these events if they actually happened, then you understand your concept very well.
No matter how much traders and investors learn about the dangers of overoptimization, they still want to optimize. Thus, I strongly recommend that you not use more than 4 or 5 degrees of freedom in your system. So if you use two indicators (1 degree of freedom each) and two filters in your complete system, that’s probably all you can tolerate. Filters and indicators you might consider are discussed extensively later in this book.
Postdictive Error Bias
People use postdictive errors when they use information in their testing that would actually be available only after the fact. This kind of error is very common in system testing. It is easy to make. For example, in some software, unless you are careful, you can use today’s data in your testing, which is always a postdictive error – imagine the value of being able to use today’s close to predict what prices will do today. That’s postdictive error.
Sometimes these errors are quite subtle. For instance, since the highest prices in your data are nearly always followed by lower prices; it’s quite possible to sneak high prices into a trading rule so that the rule works great – but only postdictively.
When you are testing data, if your results seem too good to be true, they probably are. You probably got those results through postdictive errors.
Bias of Not Giving Yourself Enough Protection
When you design a system, your goal should be to design a system that produces low-risk ideas. My definition of a low-risk idea is this:
A methodology with a long-term positive expectancy and a reward (overall return) to risk (maximum peak-to-trough drawdown) ratio with which you can live. That methodology must be traded at a position sizing level (usually based on a percentage of equity) that will protect you from the worst possible conditions in the short run while still allowing you to achieve the long-term expectancy of the system.
The bias that most people have is that they do not trade at a position sizing level that is low enough to protect them from such worst-case scenarios in the short run. Most people cannot, and do not, anticipate all possible events that might affect their systems. Consequently, in any worthwhile trading or investing methodology, you must have all kinds of backups to protect you when you’re in a trade that’s going against you.
If you ask the average person, “How will you get out of a bad trade if it really goes against you?” he or she has no answer. Most people just don’t have the backup protection they should have. More importantly, they trade at way too high a level. If you have $50,000 and are trading fiver or more different futures contracts simultaneously, then you are probably trading at too high a risk level. If you are a day trader and you get margin calls, then your risk level is way too high. That risk level may get you high rates of return, but it will eventually bankrupt your account. Think about the protection bias. Paying attention to this bias alone could preserve much of the equity that you currently have in your account.
Biases That Affect How You Trade Your System
Let’s assume that you have gone through a system, thoroughly tested it, and determined it to be something you can trade. Unfortunately, there are still more biases that tend to cause people to override their systems.
You want maximum performance, so there is always a temptation to override your trading system. The few times you have done something to override your system and improve your performance really stand out in your mind. You tend to forget the times that didn’t work and the day-in, day-out slippage (that is, the cost of trading) that have affected your bottom line.
If you don’t have a trading system, then numerous biases affect your trading. However, several key biases come into play even when you have the best of systems. Let’s take a look at these biases that tend to cause people to override their systems.
Bias of the Gambler’s Fallacy
The gambler’s fallacy is a natural consequence of the randomness bias. The gambler’s fallacy is the belief that when a trend is established in a random sequence (or in the market, for that matter), the trend could change at any time. Thus, after four consecutive up days in the market, we expect a down day. Even people who are well-respected researchers of the market suffer from this bias. For example, Larry Williams, in my opinion, shows this bias in the following quote: “After you have had three or four losing trades in a row, the probability of the next trade being not only a winner but a substantial winner is way in your favor.”
When you understand what’s involved in winning, as do professional gamblers, you’ll tend to bet more during a winning streak and less during a losing streak. However, the average person does exactly the opposite: he or she bets more after a series of losses and less after a series of wins.
Ralph Vince once did an experiment with 40 Ph.Ds. They were asked to play 100 trials of a simple computer game in which they would win 60 percent of the time. They were each given $1,000 in play money and told to bet as much or as little as they wished on each of the plays. None of the PhDs knew position sizing (that is, the effect of bet size on the performance of such a game).
How many of them made money? Only 2 of the 40 participants had more than their original $1,000 at the end of the game – or 5 percent. But had they bet a constant $10 per bet, they would have ended up with about $1,200. And if they had bet optimally for achieving the maximum gain (Which was to risk 20 percent of their new equity each time – an approach not advocated by this author), they would have ended up with about $7,490 (on average).
What happened? The participants tended to bet more after an adverse run and less after a favorable run. Let’s say the first three bets are losers, and you bet $100 each time. Now you are down to $700. You think, “Since I’ve had three losses in a row and the odds are 60 percent in my favor, I’m sure it’s time for a win.” As a result, you bet $400. But you suffer another loss. Your stake is down to $300, and your chances of making it back are almost nonexistent.
The gambler’s fallacy bias enters into how most people develop trading systems, how they size their positions, and how they trade. They totally ignore the randomness element. They look for certainty and trade their systems as if they had it, not giving themselves enough protection. Thus, they don’t even consider position sizing as part of their system.
Conservative-with-Profits-and-Risky-with-Losses Bias
Perhaps the number 1 rule of trading is to cut your losses short and let your profits run. Those who can follow this simple rule tend to make large fortunes in the market. However, most people have a bias that keeps them from following either part of this rule.
Consider the following example in which you must pick one of two choices. Which would you prefer:(1) a sure loss of $9,000 or (2) a 5 percent chance of no loss at all plus a 95 percent chance of a $10,000 loss?
Which did you pick, the sure loss or the risky gamble? Approximately 80 percent of the population picks the risky gamble in this case. However, the risky gamble works out to a bigger loss (that is, $10,000 x 0.95 + 0 x 0.05 = $9,500 loss – which is larger than the sure $9,000 loss). Taking the gamble violates the key trading rule – cut your loses short. Yet most people continue to take the gamble, thinking that the loss will stop and that the market will turn around from here. It usually doesn’t. As a result, the loss gets a little bigger, and then it’s even harder to take. And that starts the process all over again. Eventually, the loss gets big enough that the gamble becomes forced to take it. Many small investors go broke because they cannot take losses.
Now, consider another example. Which would you prefer: (1) a sure gain of $9,000 or (2) a 95 percent chance of a $10,000 gain plus a 5 percent chance of no gain at all?
Did you pick the sure gain or the risky gamble? Approximately 80 percent of the population picks the sure gain. However, the risky gamble works out to a better gain (that is $10,000 x 0.95 + 0 x 0.05) = $9,500 gain – which is larger than the sure gain of $9,000). Taking the sure gain violates the second part of the key rule of trading – let your profits run.
Once they have a profit in hand, most people are so afraid of letting it get away that they tend to take the sure profit at any sign of a turnaround. Even if their system gives no exit signal, it is so tempting to avoid letting a profit get away that many investors and traders continue to lament over the large profits they miss as they take sure small profits.
These two common biases are well stated in the old saying: “Seize opportunities, but hold your ground in adversity.” The good trader had better use the adage: “Watch profit-taking opportunities carefully, but run like a deer at the first sign of adversity.”
My Current Trade or Investment Must Be a Winner Bias
What makes all these problems come to the forefront is the overwhelming desire of human beings to make current positions (those you have right now) work out. What happens? First, when you have a losing position, you’ll do anything to nurse it along, hoping it will turn around. As a result, losing trades tend to become even bigger. Second, people take profits prematurely in order to make sure those profits remain profits.
Why? People have an overwhelming desire to be right. Over and over again, I hear traders and investors tell me how important it is for them to be right when they make a market prediction or, even worse, when they invest their money in the market.
I once worked with a client who published a daily fax that gave predictions for a particular commodity. Big traders all over the world subscribed to his fax because his accuracy was outstanding. He was known worldwide for his accuracy. However, despite the fact that his accuracy was outstanding, his ability to trade that commodity was rather poor. Why? Because of the need to be right. Once a person makes a prediction, the ego becomes involved in it, making it difficult to accept anything that happens in the process of trading that seems to differ from your prediction. Thus, it becomes very difficult to trade anything that you publicly predict in any way.
Summary
The amount of information to which the average individual is now exposed doubles every year. Consciously, however, we can only process only 7 chunks of information before it is lost. As a result, we have developed a number of shortcuts or heuristics to help us cope with the vast amount of information to which we are exposed. These heuristics are useful under most circumstances, but their implications for traders and investors are so strong that my belief is that the average person has no probability of making money in the markets unless he or she deals with them. I’ve decided these heuristics into three types of biases that are summarized below.
Biases That Affect Trading System Development
Representative Bias
People assume that when something is supposed to represent something, that it really is what it is supposed to represent. Thus, we assume that the daily bar chart is the market or that our favorite indicator is the market. Instead, we need to keep in main that the representation is just a shortcut for presenting a lot of information, or even worse, a distortion of that information.
Reliability Bias
People assume that something is accurate when it may not be . For example, market data that you use in your historical testing or that come to you live are often filled with errors. Unless you assume that errors can do exist, you may make lots of mistakes in your trading and investing decisions.
Lotto Bias
People want to control the market, and so they tend to focus on entry, where they can “force” the market to do a lot of things before they enter. Unfortunately, once they enter, the market is going to do what the market is going to do. And the golden rule of trading “Cut your losses short and let your profits run” has nothing with entry and everything to do with exits.
Law of Small Numbers Bias
People tend to see patterns where none exist, and it takes only a few well-chosen examples to convince someone that a pattern has meaning. When you combine this bias with the conservatism bias (below), you have a very dangerous situation.
Conservatism Bias
Once you believe you have found such a pattern and become convinced that it works (by means of a well-chosen examples), you will do everything you can to avoid evidence that it does not work.
Randomness Bias
People like to assume that the market is random and has many tops and bottoms that they can trade easily. Yet the markets are not random. Distributions of prices show that markets over time have infinite variance, or what statisticians call “long tails” at the end of the bell curve. Furthermore, people fail to understand that even random markets can have long streaks. As a result, top and bottom fishing is the most difficult type of trading there is.
Need to Understand Bias
We attempt to make order out of the market and find reasons for everything. This attempt to find order tends to block our ability to go with the flow of the markets because we see what we expect to see rather than what is really happening.
Biases That Affect How You Test Trading Systems
Degrees of freedom bias
We want to optimize our systems, and we believe that the more we manipulate the data to fit history, the more we know about trading well. Instead, you are much better off understanding how your concept (that you are using to trade or invest) works and doing only a minimum amount of historical testing.
Predictive error bias
We can inadvertently use data in system development that, in real-life trading, will not yet have control. For example, if you factor today’s close into your analysis, then you will probably do very well in your testing – especially hen you tend to exit before the close.
Not giving yourself enough protection bias
People fail to consider that position sizing and exit strategies are a key part of trading. Consequently, they often put too much of their capital at risk in a given trade.
Biases That Affect How You Trade Your System
Gambler’s fallacy bias
People assume that the probability goes up for a win after a long losing streak or up for a loss after a long winning streak.
Conservative with profits and risky with losses bias
People want to take profits quickly and give their losses some room. This gives them the illusion of being right, but what they are really doing is cutting their profits short and letting their losses run.
My current trade or investment must be a winner bias
This bias may be at the root of all other biases. Yet being right has little to do with making money.